For eCommerce companies, it’s easy to quantify the value of marketing efforts or website and app changes; many analytics tools are designed specifically with these companies in mind. But if your business model doesn’t involve selling directly to customers, these tools can fall flat. To make matters worse, investing in analytics platforms can be time-consuming and expensive, and constant changes in the analytics industry can make it hard to stay informed—let alone get a grip on constantly emerging new buzzwords like CDPs and data warehouses.
Many non-eCommerce companies and organizations find it hard to justify the potential value of analytics efforts because they aren’t clear on how to utilize analytics platforms outside of eCommerce metrics. Some say money talks, but I say value yells: the key to maximizing digital analytics investments is to center them around value, whatever that means for your company. With proper planning and thoughtful, sometimes out-of-the-box implementations, analytics platforms can create massive value. Whether your company functions in the eCommerce space or not, this value will go well beyond the investments made to put the platforms and implementations in place.
Behind the Curve: How Analytics Pain Points Keep Companies from Driving Value

According to a 2019 survey from MicroStrategy, 94% of companies said that analytics are important to their business. However, almost half of companies (47%) noted that they either don’t have an analytics strategy or don’t have a centralized analytics tool at all. Nearly one in four companies surveyed stated that analytics tools aren’t intuitive or convenient for their business.
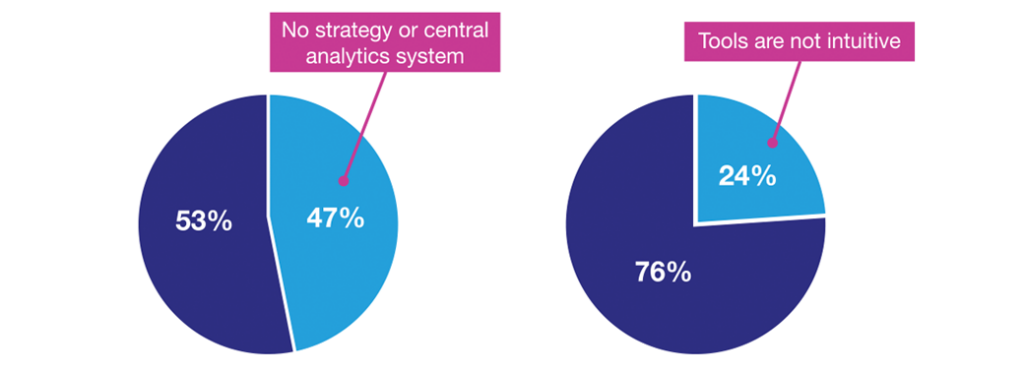
These statements speak to two key pain points some companies have when it comes to digital analytics: not knowing how to show the value of efforts being made, and not knowing how to utilize analytics platforms to their full potential.
As technology advances and social media sites continue to dominate users’ screen time, paid marketing efforts have grown increasingly ubiquitous. From establishing brand awareness to re-marketing towards those already familiar with the brand, paid marketing is a powerful tool companies can leverage to acquire more users. However, some companies may find it hard to understand the true value of paid marketing efforts; some struggle just to justify paid marketing efforts in the first place. If your website isn’t geared towards direct revenue generation, you’ll need to find other ways to understand how paid marketing efforts lead to direct value for your company.
Additionally, many analytics tools include features built specifically for eCommerce websites and applications. Many non-eCommerce companies simply don’t use these parts, leaving tools underutilized or just set aside on the proverbial back shelf to gather dust.
These pain points can leave companies and organizations at a loss when trying to understand how analytics can drive value: how on earth can they utilize these tools to understand what changes will add value to their website? How can they monitor the performance of those changes? Will they be able to learn which users visit their website and which ones offer the most value and opportunity for the company?
From Government Programs to Lifestyle Blogs: Unconventional Solutions to Real-World Analytics Problems

Quite a few analytics tools boast features geared towards the eCommerce world, but there are many ways that analytics can help non-eCommerce companies and organizations boost KPIs and improve end-user interactions on their websites and applications. Here are four use cases that can help you get creative with analytics, ultimately driving better UX decision-making and growing company KPIs without the need to rely solely on eCommerce metrics.
Use Case One: Building a More Informed Information Architecture for a Government Website
Sites geared towards providing information and external links to other sites can employ a variety of analytics features to help companies understand what information is most pertinent or popular for their users. Combining pagination clicks, search results, link clicks, pageviews, and more can lead to emerging themes and patterns that will help you get a clearer picture of what information users are accessing most, needing the most, or having the hardest time finding. This will reveal instances of content hidden too far into the content sitemap—information that you can use to improve the information architecture of your website. In this case, the buried content needs to be bubbled up to more top-level pages.
Here’s a good example: an analyst is looking at the data for a government-run site that provides information on government services, and notices the following:
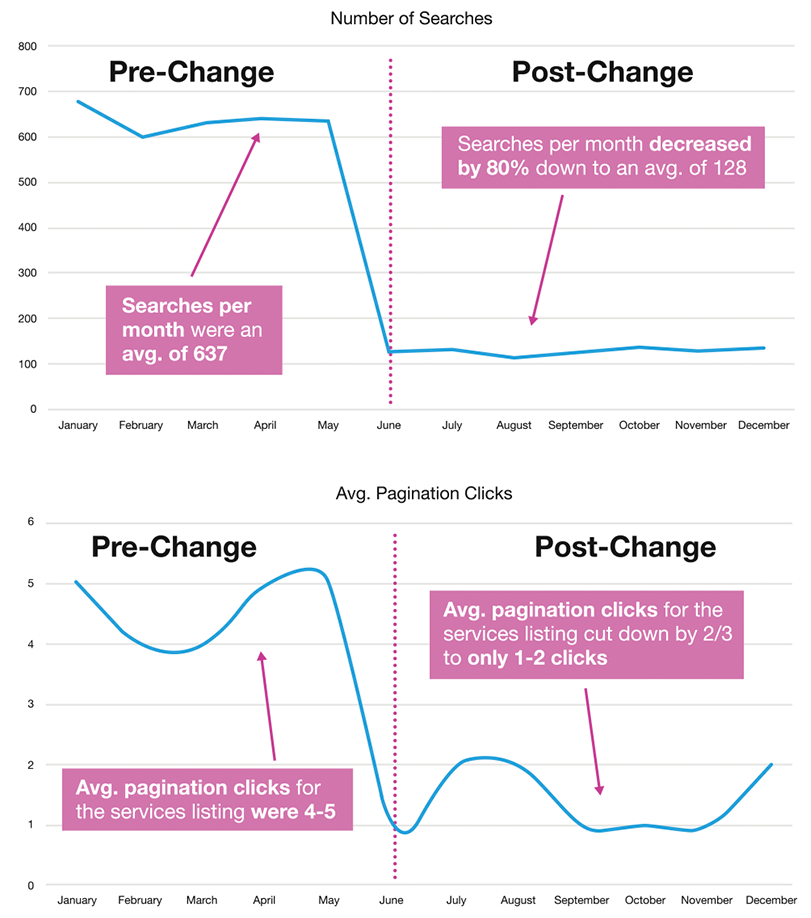
- Pagination clicks on a list of services show that users are generally clicking to 4-5 page results before finally either searching, returning to the homepage, or exiting the site altogether.
- Users that searched entered similar search terms regarding the “Supplemental Nutrition Assistance Program”, and most of those terms are in the top ten searches for the entire website.
- When users are sent directly to the Supplemental Nutrition Assistance Program Program page via organic search or paid marketing efforts, there is a 70% positive interaction rate.
- The third highest channel for those landing on the program page is direct, meaning most users probably bookmark the page once they manage to find it.
When put together, these data points make a strong case that users want information about the Supplemental Nutrition Assistance Program, but typically have a hard time finding it. Reviewing the sitemap shows that this page sits four levels deep and 4-5 pages into the category listing depending on the category being looked at; this data point lines up with the pagination click data. Armed with this new information, the organization decides to update their category structure, finding ways to optimize the categories and bring that page up to the first page on the category listing along with adding a featured link to it on the homepage.
As a result of these changes, the organization sees that search results for the program have gone down by 80%, while pageviews for the program page have gone up and pagination click counts have gone down to just 1-2 page results. These data points show the positive impact these changes have had, with users finding the information faster with less frustration and fewer rage exits. This change wouldn’t have even been on the radar if the organization hadn’t been utilizing analytics to review their user experiences.
Use Case Two: Analyzing a Bank’s Support Center Needs to Deliver Cost Savings
While analytics can help inform decisions about how to improve the user experience, we still need to see how that can translate into true value for a company or organization. When you use data to make informed changes to a website, then combine that data with various other internal data sources, you can start to see a positive ripple effect on other areas of your company.
Consider a bank with an online portal for bank customers. The bank has a customer support call center staffed with 25 employees, and gets an average of 500 calls a day. Each employee can take an average of three calls per hour and has an average salary of $50k a year. When looking at the analytics for their website from over the past six months, the analyst notices the following:
- Search results for the term “account error code 682” ranked as the third highest search term.
- The account troubleshooting FAQ page climbed from tenth to fourth on the top pages list.
- The most-clicked item on the FAQ page was the hyperlinked support phone number, which was clicked 10% more often than any other hyperlink on the page in the past six months.
When looking at the account troubleshooting FAQ page, the analyst finds that there are no FAQs regarding “account error code 682”; and when conducting a search, only two results come up (neither of which solves the issue). The analyst decides to dig a bit deeper by looking at internal data from the call center and finds that:
- The most common theme for support calls over the past six months was “account error code 682”.
- Calls related to “account error code 682” took more time than the average call, bringing the average call handle to two calls an hour instead of the normal three.
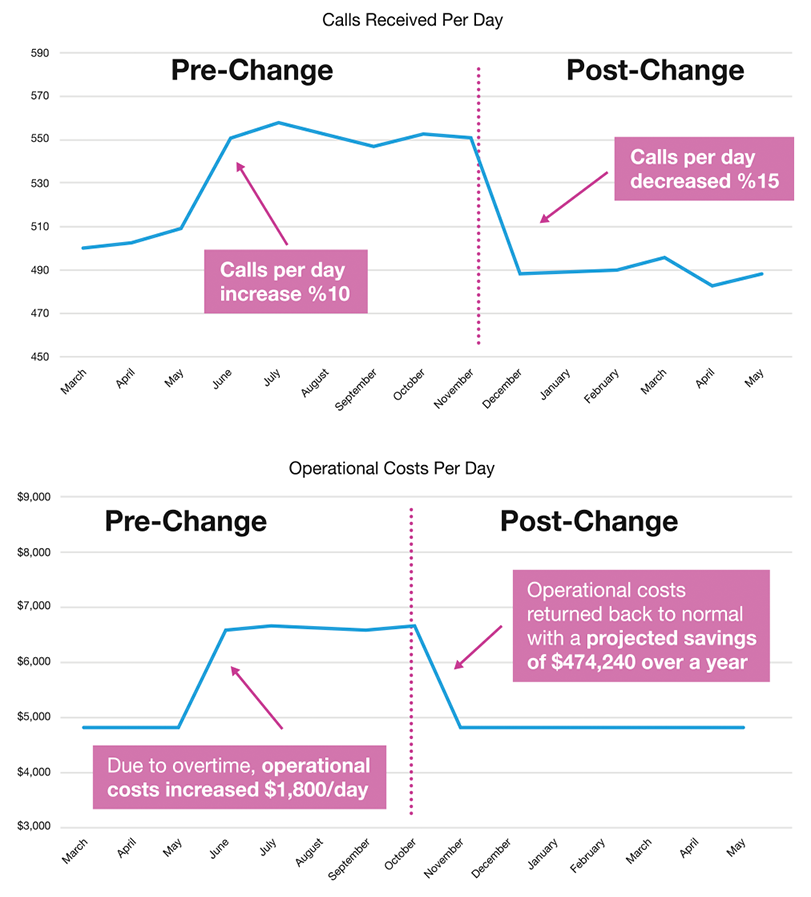
- The volume of calls received over the past six months increased by 10%, causing some workers to put in overtime to respond to calls in accordance with the company’s SLAs (service-level agreements).
After combining these data points, the analyst decides it’s time for a change. She puts in a request to the web team to add pertinent content to the account troubleshooting FAQ page, along with a guided page that outlines exactly how the user can solve for “account error code 682”. When looking at the data following the change, the analyst finds that:
- Searches regarding “account error code 682” decreased by 30%.
- The support phone number clicks from the account troubleshooting FAQ page decreased by 7% comparison rate over other pages (2% less than the usual).
- The number of support calls decreased by 15%.
These numbers already sound great, but the analyst takes it a step further in order to show the true value this small change created for the bank. After running the numbers, the analyst determines that this change allowed the call center to support 68 more support calls a day and saved the bank an average of $1,824 in support center-related operational costs each day. Over the course of a year, this adds up to $474,240 in savings for the bank.
Use Case Three: Tailoring Influencer Content to Get the Most Out of External Sponsorships
While some companies sell items directly to consumers, other businesses or individuals with a digital presence do so through external partnerships. In these cases, a typical eCommerce setup won’t work, and in many cases simply doesn’t apply. However, non-eCommerce companies and organizations can still take advantage of analytics to understand how their digital presence creates value and impact on their brand by focusing on content copy and feature engagements instead.
Here’s an example: a fitness influencer focuses on providing information about healthy living and exercising techniques. They’ve tailored their content to include workout tips, nutrition recipes, and athletic gear recommendations. They have partnered with several businesses in different health lifestyle categories so that, when users use specialized codes or links to shop on partner sites, the influencer receives a portion of the money from the purchase. While looking at the analytics for their website, the influencer notices the following:
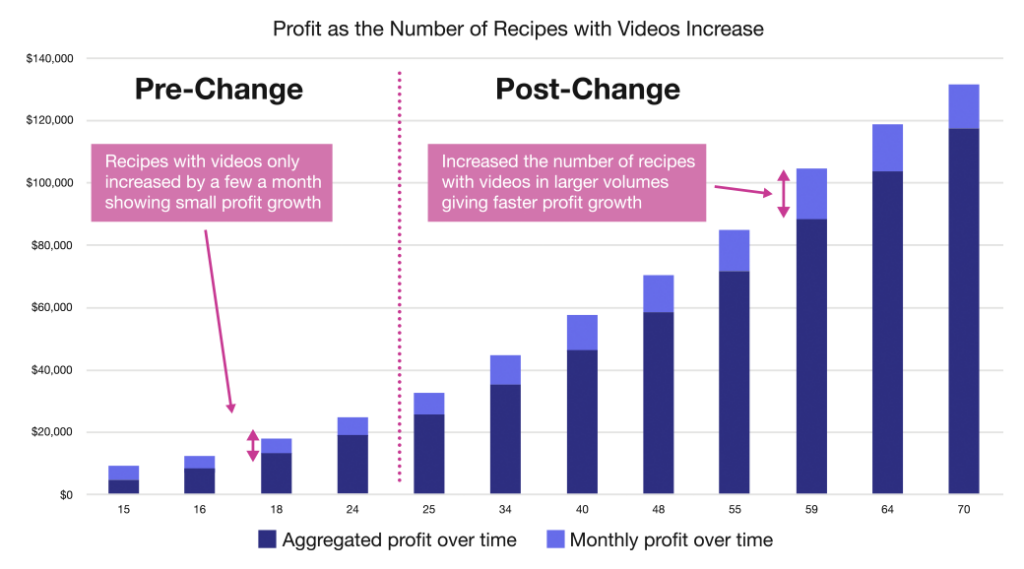
- Users are two times as likely to buy food box subscriptions when the recipe article is accompanied by a video.
- Users who purchased partner products are more likely to come back to the website and view more content, leading to additional product purchases.
- Users are also three times more likely to click on a link mentioned at both the beginning and the end of the article, rather than one or the other.
Using this information along with data about the proceeds they get from the affiliate company, the fitness influencer can see which types of content drive sales of partners’ products. They can then tailor the context and formatting of their content in a way that maximizes the profits they earn from their partner companies.
Use Case Four: Leveraging Unconventional eCommerce Metrics on a Nonprofit Blog
While many non-eCommerce companies ignore the eCommerce-specific features of their analytics platforms altogether, some choose to use them in unconventional ways. Getting creative with eCommerce metrics and reports can really bring a fresh take to your data, and can go a long way in ensuring the costs and effort required to run the platform are worth the output it provides.
As an example, consider a nonprofit company whose primary focus is a blog website. They don’t sell any products or services; instead, their objectives are built around creating social awareness for their cause. Rather than simply ignoring the eCommerce features of their analytics platform, they decide to take a unique approach that leverages these reports and metrics for their specific needs.
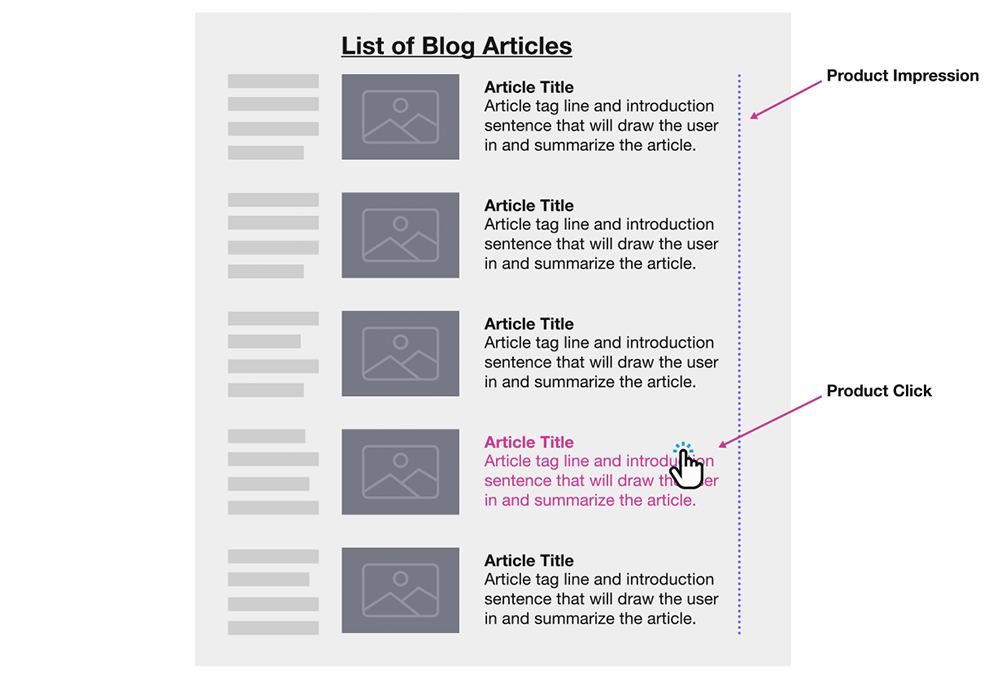
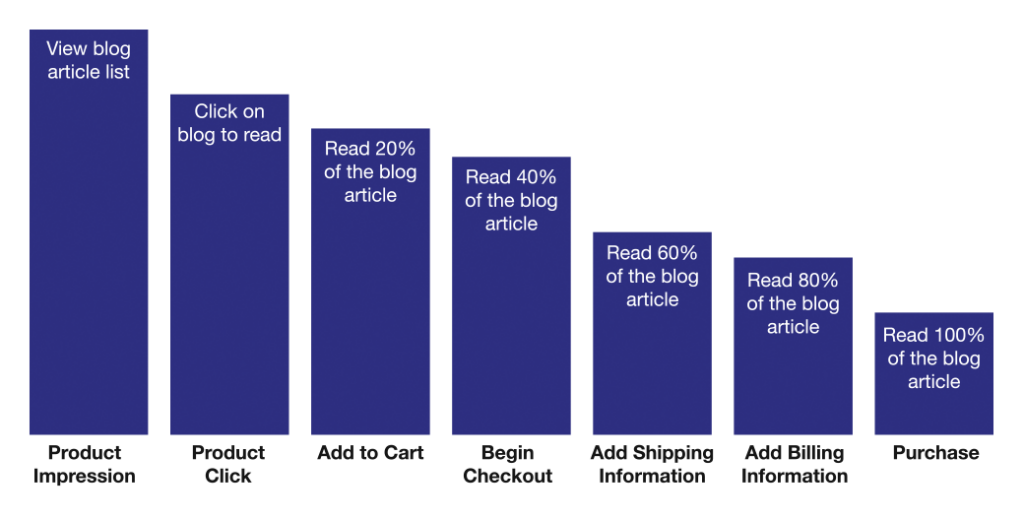
By treating their blog articles as products, the company uses product impressions to see what blog articles were shown to the user: viewing a list of articles is equivalent to viewing a product list, and clicking through to an article on the list is equivalent to making a product selection. Using the data in this way allows the nonprofit to understand which articles in lists are clicked on the most, what the percentage of clicks vs impressions is, and so on.
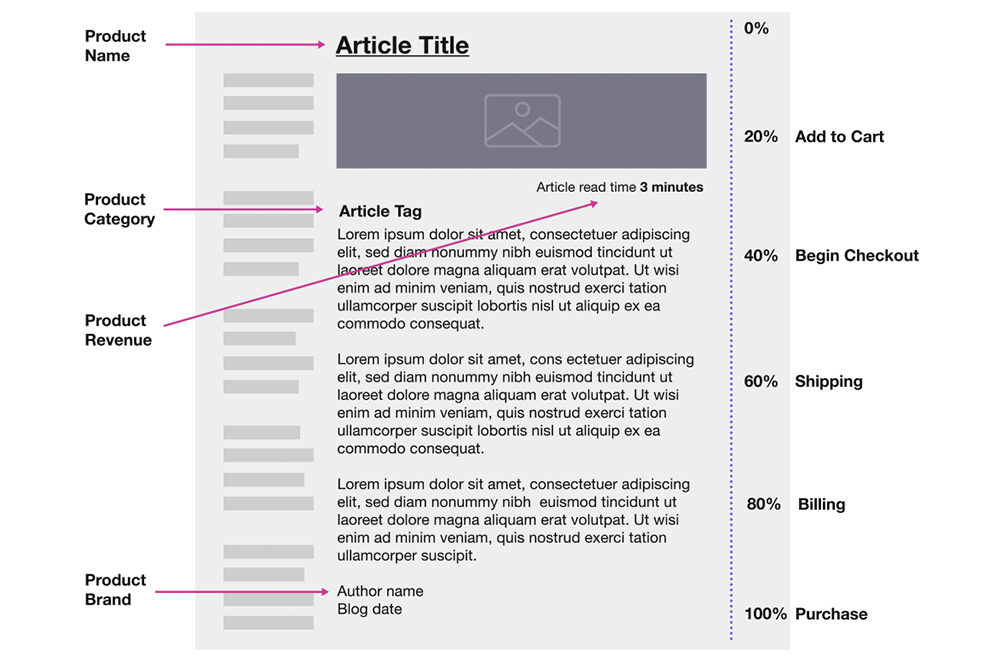
From there, they fire the “add to cart”, “begin checkout”, “shipping”, and “billing” stages of a standard checkout flow, based on the scroll depth the user reached on the article at 20%, 40%, 60%, and 80% respectively. Once the user reaches the point on the page where the article ends (100% scroll depth), the company fires a purchase event. They then push elements such as the article title, blog author, and blog tag as parallels to the more standard product name, brand or affiliation, and product category. Finally, they push the estimated read time of their blog articles into the revenue or value metrics.
By setting up tracking this way, the nonprofit is able to see user journeys in a whole new light. This setup provides them with funnel reports and conversion metrics to show which articles were the most enticing, and which ones brought the user in but ultimately saw them skip out early (cart/checkout abandonment) or ignore the content altogether.
This setup is highly unconventional, but it opens so many more opportunities to examine and analyze the data for maximum value—all in a format that works for the company.
All four of these use cases showcase situations in which an organization doesn’t directly generate revenue from their digital presence, but still requires analytics capabilities. For these types of organizations, knowing how to utilize analytics platforms in creative ways that fit their needs is key: it allows them to show real value and find new opportunities for growth.
Value, not Revenue: How to Think About Digital Analytics Outside of eCommerce

Many analytics platforms boast about how their product helps companies increase revenue and understand their sales, but this leaves non-eCommerce companies and organizations scratching their heads. They’re often on their own in figuring out how they can maximize analytics platforms and quantify the value their efforts create for the company. By thinking about analytics as a tool to not just increase revenue but also to increase value and improve user experiences, non-eCommerce organizations can take full advantage of the analytics platforms available to them. To sum things up, there are four ways that an organization can accomplish this:
- Focus on content changes, such as bubbling up popular information in your information architecture, for more positive user experiences.
- Combine user interactions on your digital touchpoints with information from internal data systems to quantify operational savings rather than revenue increases.
- Focus on key user interactions to understand how to best tailor the context, layout, format, and style of your content to maximize KPIs.
- Look at outside-the-box ways that eCommerce metrics can clarify impact on outside income sources.
While revenue is an exciting metric that most companies constantly look to increase, changing your mindset to value—whatever that may mean for your organization—enables everyone to take full advantage of the insights digital analytics can offer.
If you’re still struggling to get a handle on your analytics needs, contact us: we’ll help you find the right analytics tools and implementations for your company, no matter how you measure success.

