Producing amazing and informative dashboards is a great step forward, but it’s just the start of the ascent. All of your hard work in dashboard creation will quickly topple if you don’t prioritize reliability. Nothing lasts forever without regular maintenance, and dashboards are no exception. In this second part of our three-part dashboard series, we’ll dive into the importance of reliability and how to foster it in everyday practices.
To make a dashboard effective, users must have confidence that the dashboard is accurate and efficient. Reliability issues will render any dashboard almost useless in the eyes of a stakeholder. However, there are ways to keep a dashboard as reliable as possible through design and governance. Some examples include:
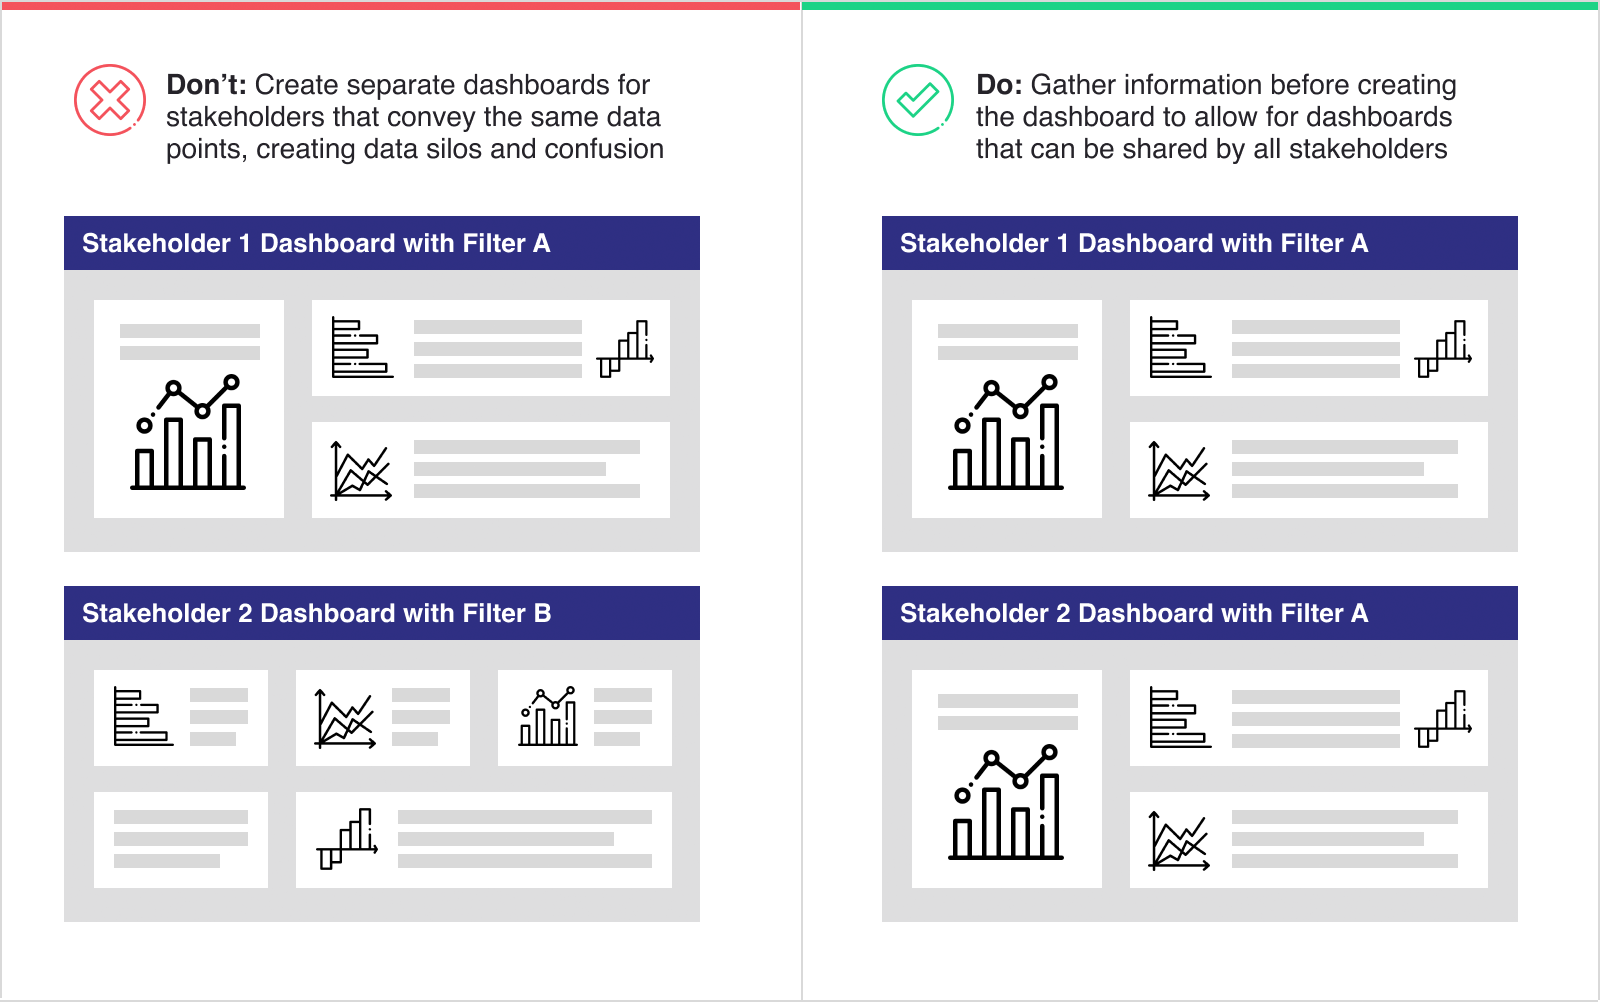
- Building dashboards that are distributed to all team members, so everyone sees the same data
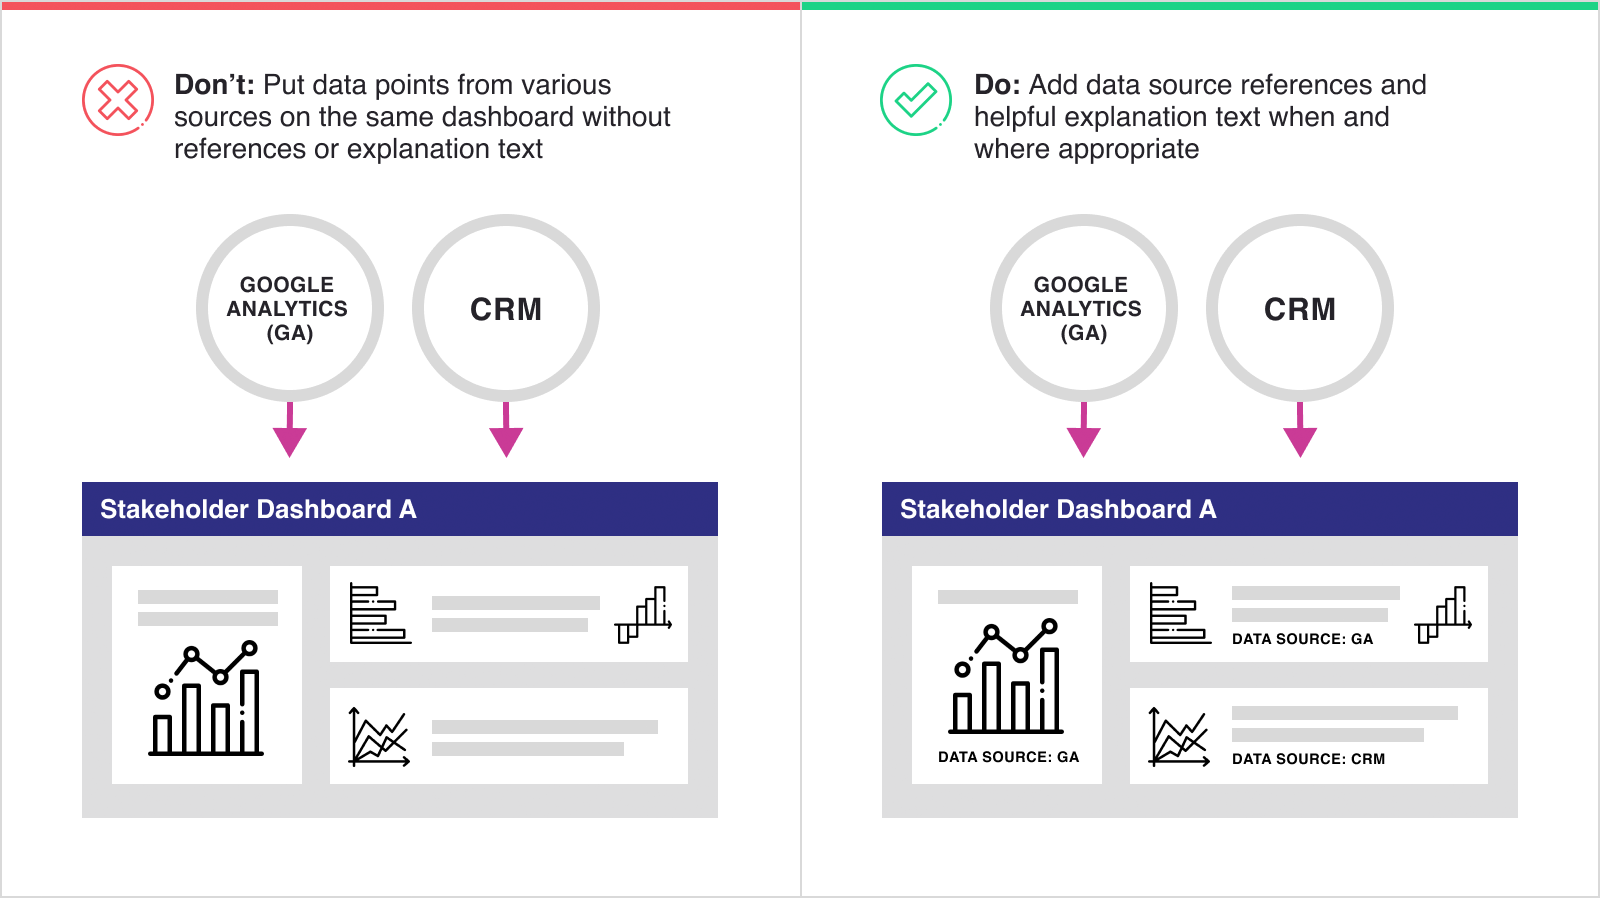
- Including references to data sources and adding explanation text where needed
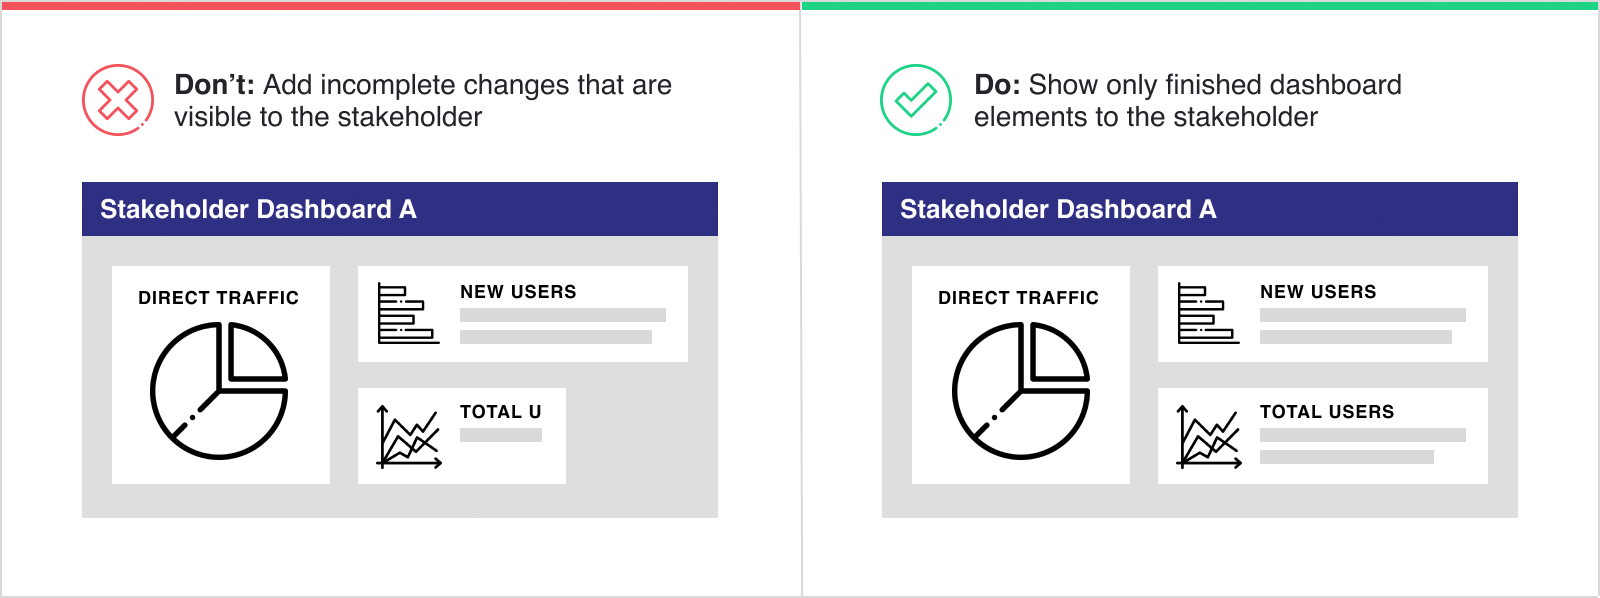
- Ensuring the ability to publish changes only when completed, so unfinished updates are not visible to the stakeholder
Keep Stakeholder Dashboards Consistent Across the Company
Dashboards let us present data to those who may not be familiar with analytics tools, don’t have proper tool access, or need a central place for key metrics from different data tools. Take advantage of features that allow you to share interactive dashboards or event statistics with multiple stakeholders across the company. This ensures that everyone who needs to see the data sees the same data presented in the same way.
Showing one version of data to some stakeholders and a different version to others can mislead team members, which creates two different views of the same data.
If some or all stakeholders can’t access the dashboards they need, silos will develop and cause an imbalance of data literacy and knowledge across teams. Additionally, showing one version of data to some stakeholders and a different version to others can mislead team members, which creates two different views of the same data. This confusion can sow doubt as to which interpretation is trustworthy. When some stakeholders are less knowledgeable than others about the inner workings of the data tool and technical jargon, the resulting confusion can foster false assumptions that slow the whole team down. These reasons and more are why reliability plays a critical role in dashboard creation.
Add Information and Explanation to Reduce Confusion
Dashboards are great for creating a centralized place to view data, and it’s common to pull data from multiple data sources within the same dashboard. It’s essential to include references to these original data sources, so that everyone looking at the dashboard understands where the data came from. Without proper source references, stakeholders may question or mistrust the data.
The risk of data misinterpretation becomes much higher if there are unexplained nuances in the data or if important background information is missing
In his article, 10 Ways to Make your Dashboards More Actionable, data storytelling expert Brent Dykes states that “by adding background information to key metrics such as period-over-period comparisons, targets, and industry benchmarks, the audience gains a deeper perspective on the displayed results.” The risk of data misinterpretation becomes much higher if there are unexplained nuances in the data or if important background information is missing. Additionally, if a stakeholder doesn’t know how to use the functionality in an interactive dashboard, they may miss opportunities to make the most of the dashboard — ultimately resulting in redundant questions later.
Use Features to Encourage Timely Change Without Losing Progress
Dashboards are flexible, living, breathing documents. As data needs, company goals, and functionality and layouts change, dashboards must also keep pace. However, if a stakeholder is accustomed to seeing certain information in their dashboard and that information changes drastically or goes missing, frustrations and distrust can set in. Prior communication is key to preventing these issues.
Sudden, drastic changes to a stakeholder’s dashboard can cause frustrations and diminish trust in the data.
When working in a tool with publishing settings, such as Google Data Studio, ensure those settings are enabled. Publishing settings allow analysts to make changes without disrupting a stakeholder’s current working session in the dashboard. Working in draft mode and publishing only when the changes are ready for viewing can also reduce the likelihood that stakeholders will see incorrect data or data that isn’t yet ready for wider viewing.
Only as Strong as The Collective Elements
When you build a dashboard with trust in mind, the dashboard becomes infinitely more reliable and effective. Dashboards are there to answer questions and ignite curiosity for insights, not to break down trust in the data or trigger questions prompted by poor presentation of the data and not flaws in the data itself. Take the time to certify that a dashboard is accessible to all who need it, add necessary explanation text, include data sources, and take care to show only the data points that are ready for wider viewing.
Take the time to test your dashboards and confirm that they’re set up for success and long-term reliability.
Dashboards are a foundational tool for analytics and data work, but the tool only works as intended when every element serves the ultimate goal. Take the time to test your dashboards and confirm that they’re set up for success and long-term reliability. Ignoring the potential pitfalls early on only guarantees future problems.
Have you built a dashboard recently, or do you already deploy dashboards across your organization? Revisit them and double-check that they’re consistent, readable, and reliable for every audience. Need a second pair of eyes on your dashboards or want to make them more effective? Reach out to BlastX Consulting for support.