As someone who has been in the digital experience optimization and analytics space for over twelve years, I’ve used more online calculators than I can count. They all (mostly anyways) have their place, but none of them are conveniently helpful during the planning phase of A/B testing.
Yes, there are other free calculators that will compute sample size, Minimal Detectable Effect (MDE) and test duration. The downside is that these calculations have to be done for each individual test, which makes it difficult to see the big picture and to prioritize your opportunities in a single place like you can with the Blast A/B Test Planning Calculator.
Why an A/B Test Planning Calculator?

We wanted to build a calculator that’s convenient; but more importantly, our optimization clients ask similar questions about the planning phase of A/B testing so this calculator was built with them in mind. Convenience is really a byproduct of the solution.
So let’s poke the bear a little about what’s wrong with other A/B test calculators on the market.
Problems with Existing Calculators While A/B Test Planning
Don’t get me wrong. There are good A/B test calculators out there (e.g., Adobe Target Sample Size Calculator, VWO Sample Size Calculator), and there are a lot of free ones, but they’re not great for planning or for prioritizing a list of potential test ideas. There are two main issues we wanted to build a solution for:
- They can only calculate test duration for a single test, not across multiple tests
- They don’t calculate revenue potential
They Can Only Calculate Test Duration for a Single Test, Not Across Multiple Tests
While I admire the simplicity of some A/B test calculators out there—like the ones mentioned above—they’re limited to one test calculation at a time.
For example, let’s look at VWO’s A/B Test Duration Calculator. In order to calculate test duration (displayed at the bottom of the screenshot) there are a few required fields for each test: the baseline conversion rate, MDE (the estimated lift), number of variations, daily visitor counts and the percentage of traffic included in the test.
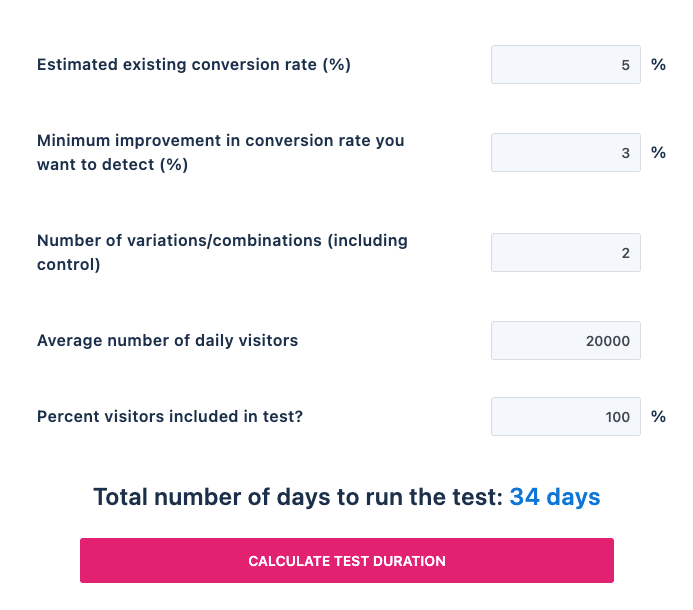
That’s great if you want to estimate how long it will take to run an experiment for a single audience or page, but what if you want to estimate test duration across multiple audiences or for your entire backlog of tests? And what if you want to prioritize your backlog of ten or twenty ideas across your digital experience based on test duration? If you’re looking for this type of flexibility, calculators like this one are inconvenient and become bottlenecks for your program. The simplicity of this type of calculator becomes its downfall in many ways.
TIP: If your backlog of test ideas are low quality or if you don’t have one developed yet, click here to read about two frameworks that ensure success.
They Don’t Calculate Revenue Potential
Post-test revenue impact is a topic that most digital experience optimization programs try to avoid, and rightfully so. It’s incredibly problematic to extrapolate results from a sample of test data and then apply it to future performance data not represented during the test. This alone is a good enough reason for why other test calculators exclude revenue impact calculations.
Revenue estimates don’t have to be perfect; but when revenue can be applied to test ideas, it’s generally a preferred input for prioritization.
And while I understand these reasons and caveat forecasted test performance calculations myself, the reality is that test ideas with revenue estimates (when possible) are better received by those prioritizing. Revenue estimates don’t have to be perfect (because they won’t be), but when revenue can be applied to test ideas, it’s generally a preferred input for prioritization.
Our Solution for Both A/B Test Calculator Pitfalls
Which now brings me to our solution to these problems.
I won’t go into a lengthy explanation about how to use the calculator—a video explanation can be found in the “Resources” tab on the calculator page—but I will highlight the general process and the benefits here.
The ‘how to’ video can be found in the “Resources” tab.

How to Calculate Test Duration Across Multiple Test Ideas and Audiences
As I said before, this is a cumbersome process with other test calculators, but with the Blast A/B Test Planning Calculator you can calculate how long it will take for each test audience to run in a single document.
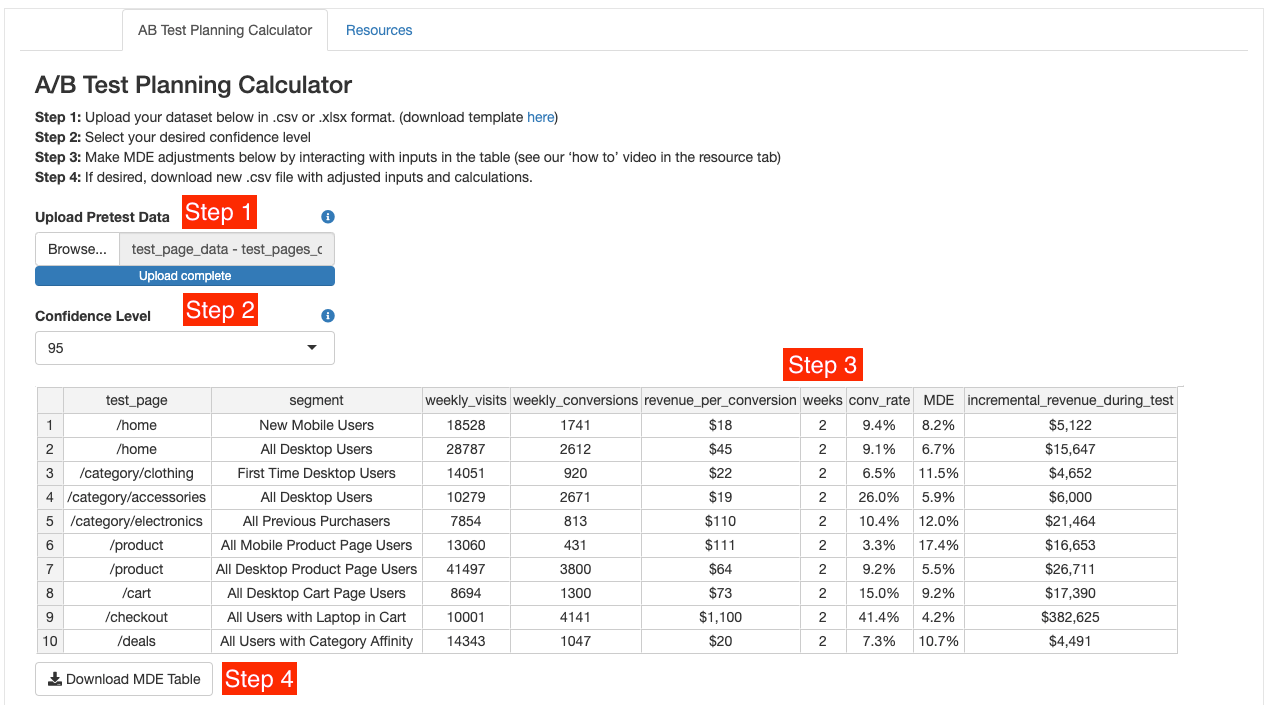
To use the calculator, follow these four simple steps:
Step 1: Upload your dataset in a .csv or .xlxl format with all test audiences. There’s no limit to the number of rows.
Step 2: Select your desired confidence level (90%, 95%, or 99%).
Step 3: Make MDE adjustments by interacting with inputs in the table.
Step 4: Download an updated working copy of your .csv file for later use (optional).
As you’ll notice, this calculator requires a little bit of pre-work—as with any test planning calculator—but once you’ve defined each potential test audience (represented by each row) the rest is pretty easy. Step 3 is where you’ll find the real value of this calculator.
After you’ve uploaded your data set and selected your desired confidence level, take a look at the MDE column. Minimum Detectable Effect (MDE) is the smallest lift improvement you’ll be able to detect. Think of this as how “sensitive” an experiment is going to be. For some audiences you might think that the needed lift is unachievable. For other audiences you might be thinking the opposite. There’s no right or wrong answer; it’s completely up to you and what you think is realistic for that particular experiment.
A/B testing really comes down to the level of risk you are willing to take; but everyone’s risk tolerance is different, so use your best judgment.
What’s great about this calculator is that you can make adjustments on the fly and across multiple tests. To do that, simply adjust the number of weeks in the “weeks” column to a number that you think is achievable for the test that you have planned. For example, in the below screenshot I changed the first row from 2 weeks to 5 weeks because I think a 5.1% lift is achievable, whereas before I thought it was unachievable at 8.2%.
Remember: if you need to detect a smaller MDE, the most common and available lever that you have is time, so increase the number of weeks that the test will need to run.
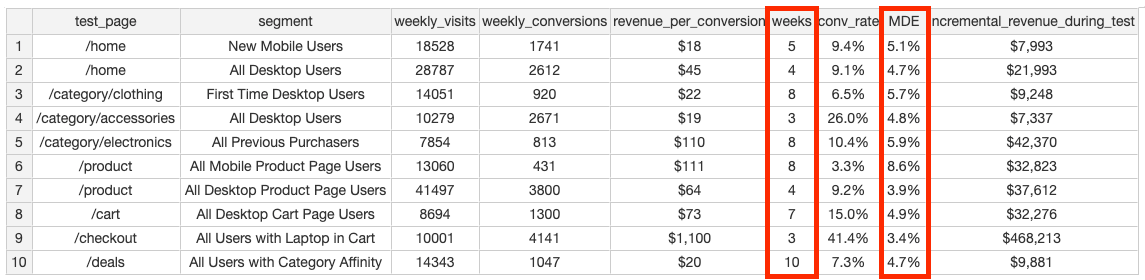
What makes this exercise valuable is that by tweaking sample size and MDE calculations across multiple potential tests, you’re able to prioritize them accordingly. In this example, I might be looking for tests that have the potential to conclude the earliest based on my traffic estimates. In that case, I might want to prioritize row 4 and row 9 above all others because they have the potential to conclude in three weeks.
Similarly, I might want to put any tests that require eight or more weeks’ worth of traffic on hold or even cancel them because I’m not comfortable running a test for that long or with the lift needed.
There are a million scenarios or reasons for prioritizing some tests over others. That, of course, is a decision you will have to make. A/B testing really comes down to the level of risk you are willing to take, but everyone’s risk tolerance is different so use your best judgment.
Once done, click the “Download MDE Table” CTA to download a new copy of your work for later use. If you don’t want to save a new file, simply highlight all cells and copy them to your existing worksheet. Or do nothing; this step is optional.
How to Calculate Revenue Potential While Planning for an A/B Test

While revenue calculations are incredibly flawed, they’re critical for gaining buy-in for a lot of businesses. And rightfully so: optimization programs can be quite costly, so with that in mind, always communicate the revenue opportunity when possible.
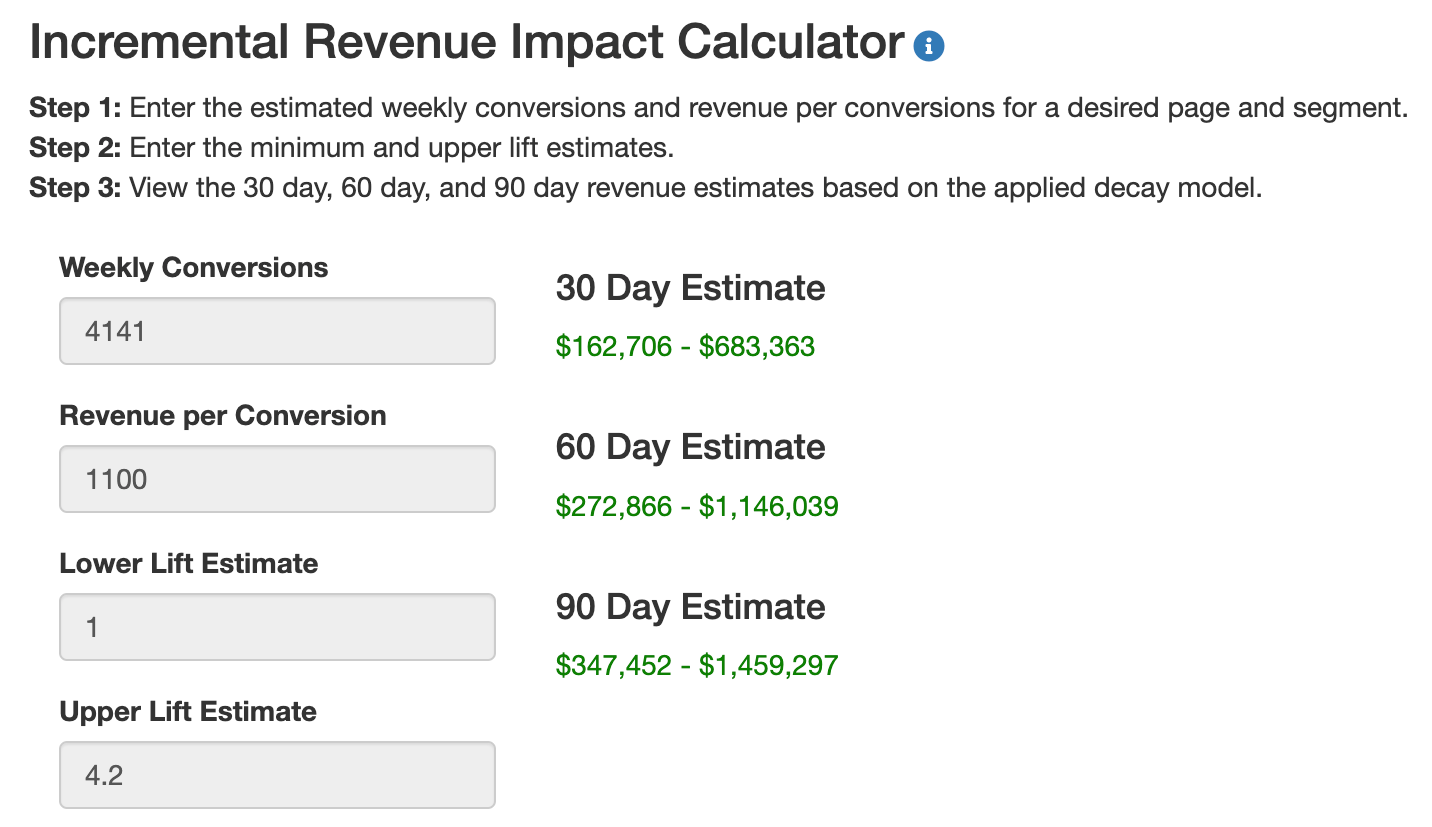
To use our revenue impact calculator, simply enter these four values:
Weekly Conversions – The average number of weekly conversions (e.g., transactions, leads, downloads, add-to-carts)
Revenue per Conversion – The average amount of revenue associated to a single conversion (e.g., revenue per transaction, revenue per lead, revenue per booking)
Lower Lift Estimate – The lowest relative lift estimate.
Upper Lift Estimate – The highest relative lift estimate.
After entering all four data points, the calculator will provide you with a 30, 60, and 90 day revenue estimate in green (the lower-bound estimate is shown on the left and the upper-bound estimate on the right). See below.
Since it’s unsafe to assume that the lift from any given test will remain as impactful for a long period of time after the test has concluded, we’ve built in a decay model for more conservative estimations while planning and prioritizing your experiments.
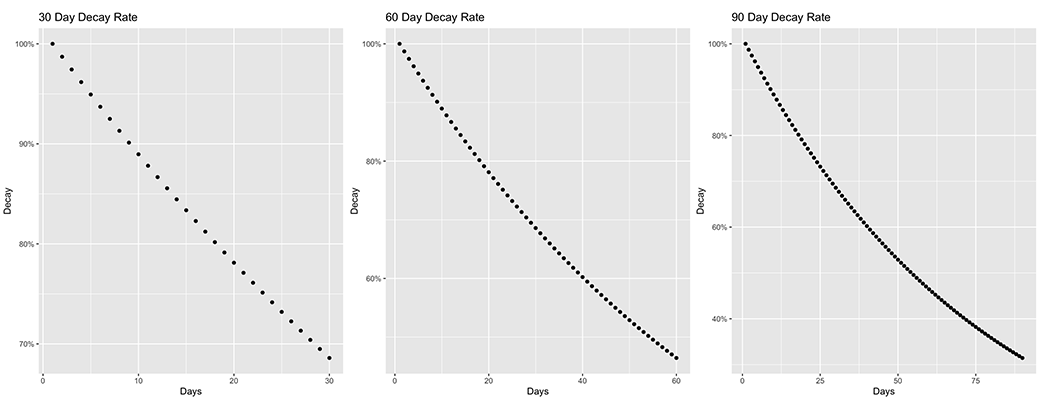
Decay rates can be described as follows:
30 Day Decay Rate – Starting the day after the test has concluded the daily decay rate is ~1.3%, for 30 days. In 30 days, ~69% of the revenue will remain.
60 Day Decay Rate – Starting the day after the test has concluded the daily decay rate is ~1.3%, for 60 days. In 60 days, ~47% of the revenue will remain.
90 Day Decay Rate – Starting the day after the test has concluded the daily decay rate is ~1.3%, for 90 days. In 90 days, ~32% of the revenue will remain.
The below plots illustrate the exponential decay rates over 30, 60, and 90 days.
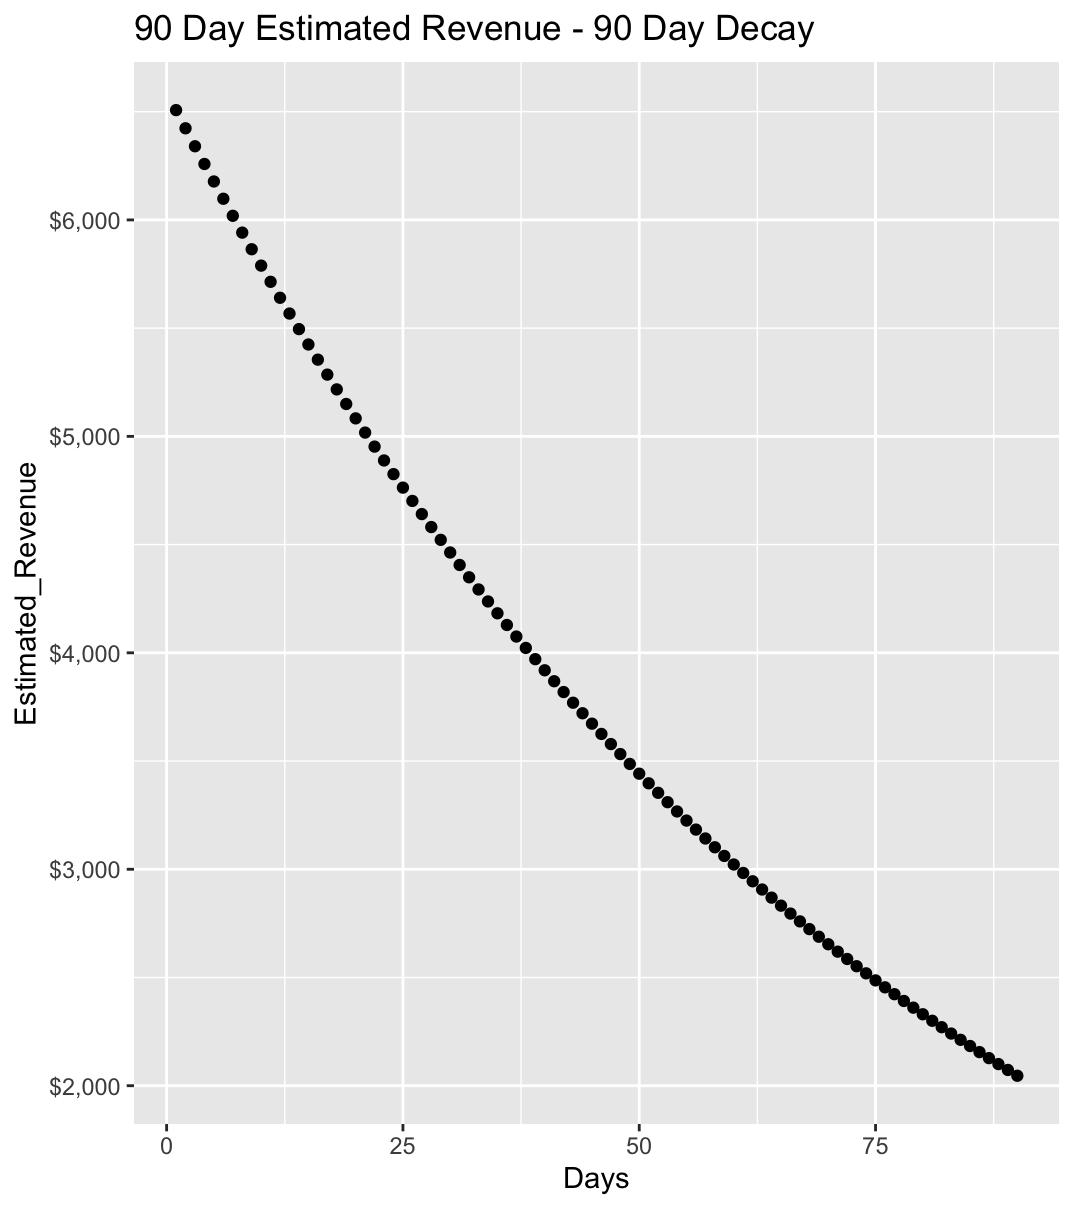
Assuming 4,141 weekly conversions, $1,100 revenue per conversion, and a 1% lift, you’ll see below that at the end of 90 days the revenue has decayed to ~32% of where it started on day one.
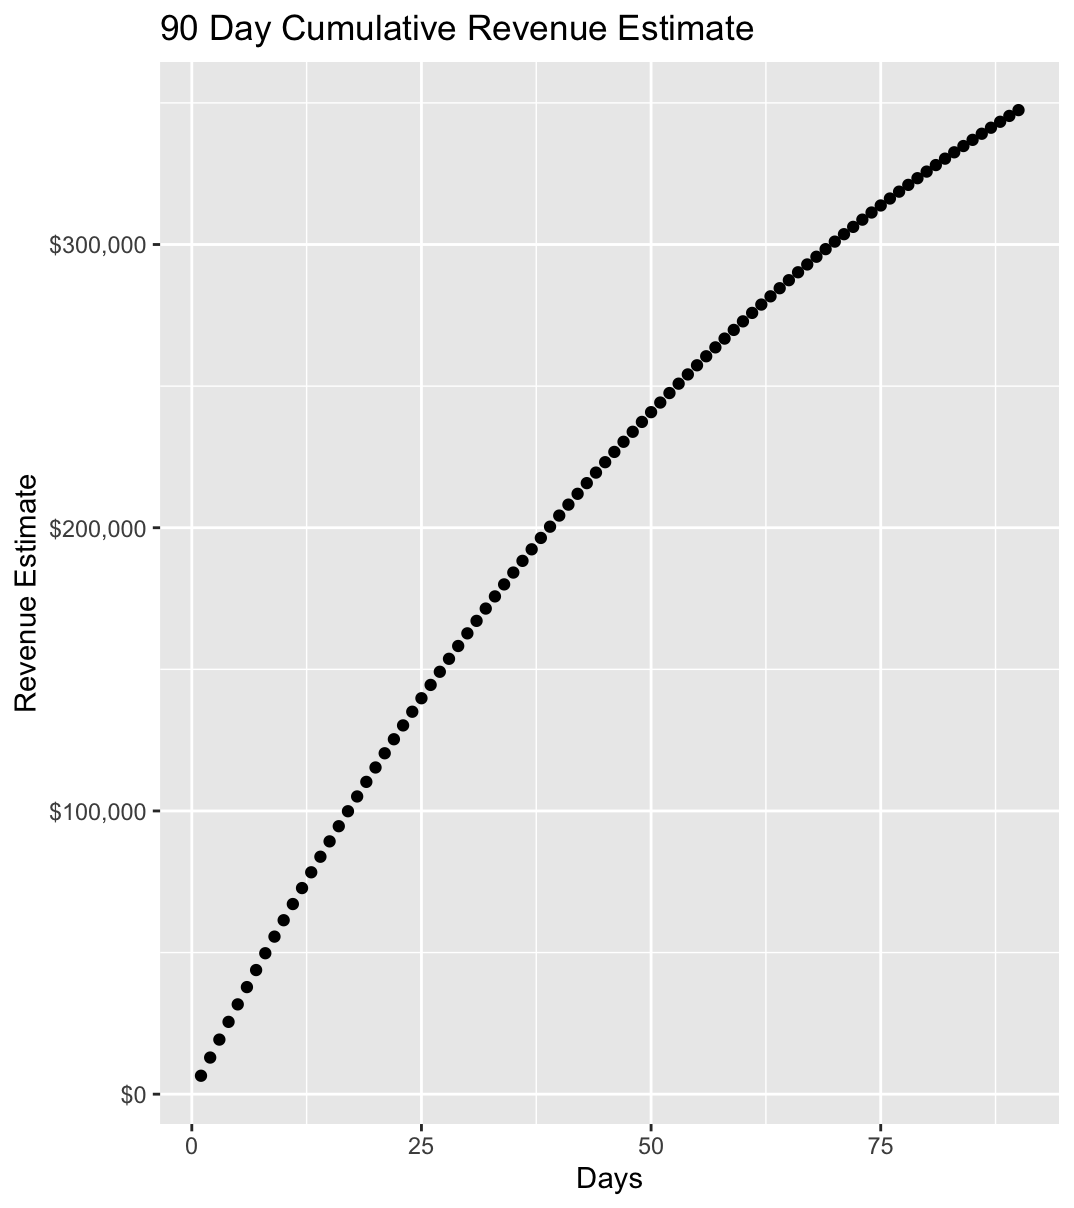
Here you’ll see that the cumulative revenue lift estimate is $347,452, which is also illustrated in the calculator screenshot above.
A/B Test Results You Can Trust
While it takes a little bit of effort to prep before using the calculator, once done you can easily use this for test planning across your digital experience. Whether you need to calculate test duration or MDE for multiple audiences, or calculate potential revenue impact over time, your team can rely on these calculations to make those important business decisions.
Please let us know if you have any questions regarding this process or the calculator.