Journey analysis has come a long way—but at this year’s Adobe Summit, I got to show just how far it’s come. I had the opportunity to speak during the Adobe Analytics Rockstar session, where I shared a few real-world ways Journey Canvas in Adobe Customer Journey Analytics (CJA) is helping teams with whom I consult move beyond reports and actually see what’s happening across the customer experience. In this Adobe CJA Tips series of articles, I’ll walk through the Journey Canvas tips I shared on stage—plus a bonus tip at the end that didn’t make the cut for the stage, but definitely should’ve.
Let’s start with the first one: Using Journey Canvas to analyze your redesigned experiences.
Analyzing Your User Journey Like It’s March Madness
If you’ve ever filled out a March Madness bracket, you know the feeling. You start out confident—maybe a little too confident—that your top picks are a lock. But every year, some scrappy underdog blows it all up, and you’re left wondering how it all unraveled so fast.
That same “how did we miss this?” moment happens a lot in digital experience design. A new layout might look like a slam dunk—cleaner interface, stronger messaging, better performance metrics on paper. But then the rollout happens, and something doesn’t quite click. It’s like when digital music was supposed to make vinyl obsolete, only for vinyl to stage a full-blown comeback. What looks better on the surface doesn’t always win with your users.
Here’s the real issue: if you’re not watching the game film—aka your customer/user journey—you’re guessing. And guesswork is where things go sideways.
So when your team launches a redesigned experience and you want to understand how it’s landing, where do you go? In Adobe Analytics, you might lean on calculated metrics, maybe a few key segments, or throw together a fallout report. Those can work, but they’re not built for quick clarity.
That’s where Journey Canvas changes the game. Inside Adobe Customer Journey Analytics (CJA), this tool gives you a full-picture view of how users actually move through your experience. One visualization and no stitching together reports. Just the story of what’s working—and what’s not—in front of you.
What is Journey Canvas?
Journey Canvas is one of the latest features rolled out in Adobe Customer Journey Analytics (CJA), landing in Summer 2024. At its core, it’s a visual workspace that lets you map how people actually move through your digital experience—using your own segments, dimensions, and metrics. Even custom calculated ones fit right in.
What makes it different from traditional flow or fallout charts is how flexible it is. You’re not stuck with static reports or rigid funnels. You build the view that fits your questions—and adjust it as those questions evolve.
For teams trying to figure out where users are dropping off, what paths lead to conversion, or how a recent change is performing, this is a major upgrade. It helps you spot friction, surface what’s working, and shape smarter decisions across product, marketing, and CX. And because it’s all in one view, you’re not wasting time toggling between tools or trying to piece together the story.
Setting Up Your Analysis in Journey Canvas
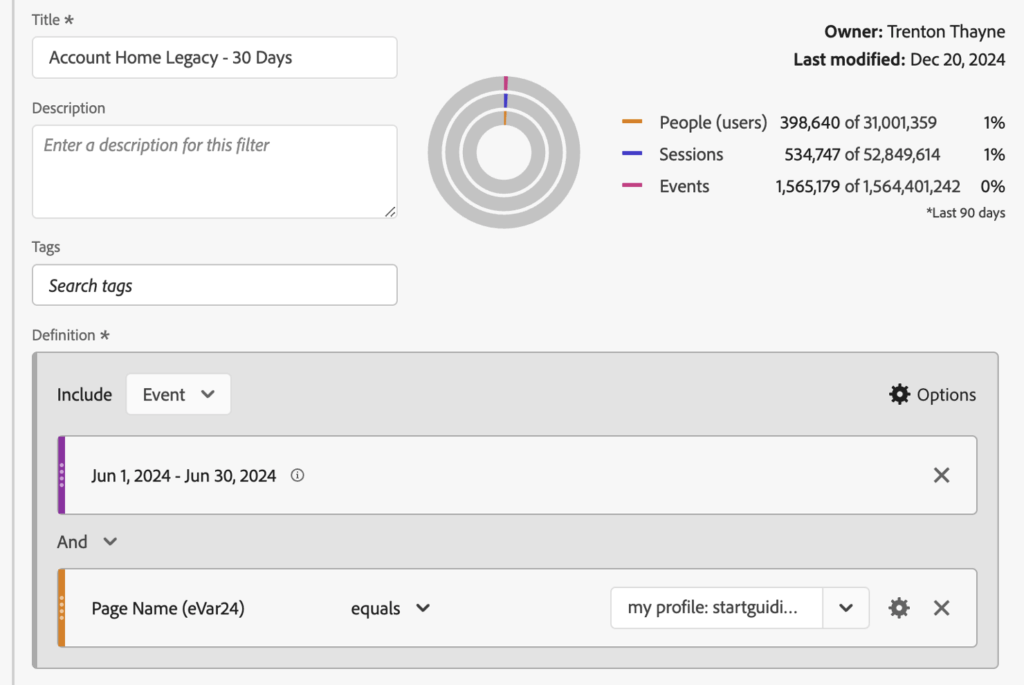
If you’re analyzing the impact of a redesign, the first step is laying the groundwork with clean, intentional segments. You’ll want to build separate ones for each stage of your user journey—and for each time period you’re comparing. Think: before vs. after, legacy vs. new.
Now in a perfect world, you’d run a proper experiment with control groups and clean variables. But let’s be real—that’s not always possible. Sometimes there’s no time, or the moment has already passed. A competitor launches a new feature. A major event hits. You need to know what changed, fast.
That’s where pre- and post-date segmentation comes in. By applying date range based filters to your segments, you can isolate legacy behavior and compare it directly with post-launch activity. It’s a small setup step with a big payoff—it gives you clarity without complexity.
And here’s where Journey Canvas really shines. Once your segments are ready, just drag them onto the canvas. Each one drops in as a node. Connect them to reflect the customer flow, and right away you’ll start to see the performance differences between the old and new experiences.
It’s that quick. No deep technical work. Just a clean, visual way to surface where things improved—and where they might need a second look.
Using Journey Canvas to Dig Deeper
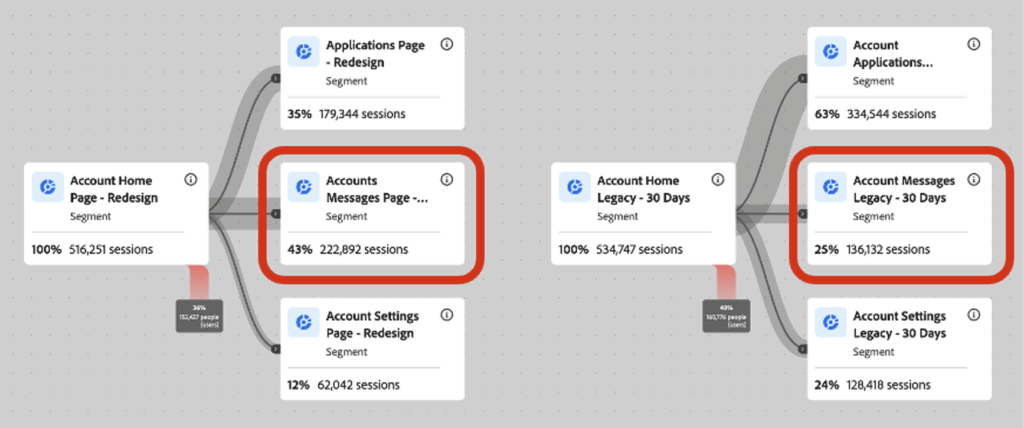
Let’s look at a real result. Using Journey Canvas in Adobe CJA, we mapped a redesigned experience and saw that 43 percent of sessions made it to the target page—compared to just 25 percent from the legacy flow. At first glance, that’s a clear win. But here’s the thing: percentages are just the starting point.
Good analysts don’t stop at the “what.” They dig into the why.
That’s where Journey Canvas is a game changer.
It’s not enough to know that your team lost in March Madness because they shot poorly. To make improvements, you need to understand what parts of the game the greatest drivers of this underperformance were. The same goes for your customer journey. It’s not enough to simply know that a certain step is severely underperforming or overperforming, as a good analyst, you need to dig deeper to determine the why. That way you can make effective and informed decisions in the future.
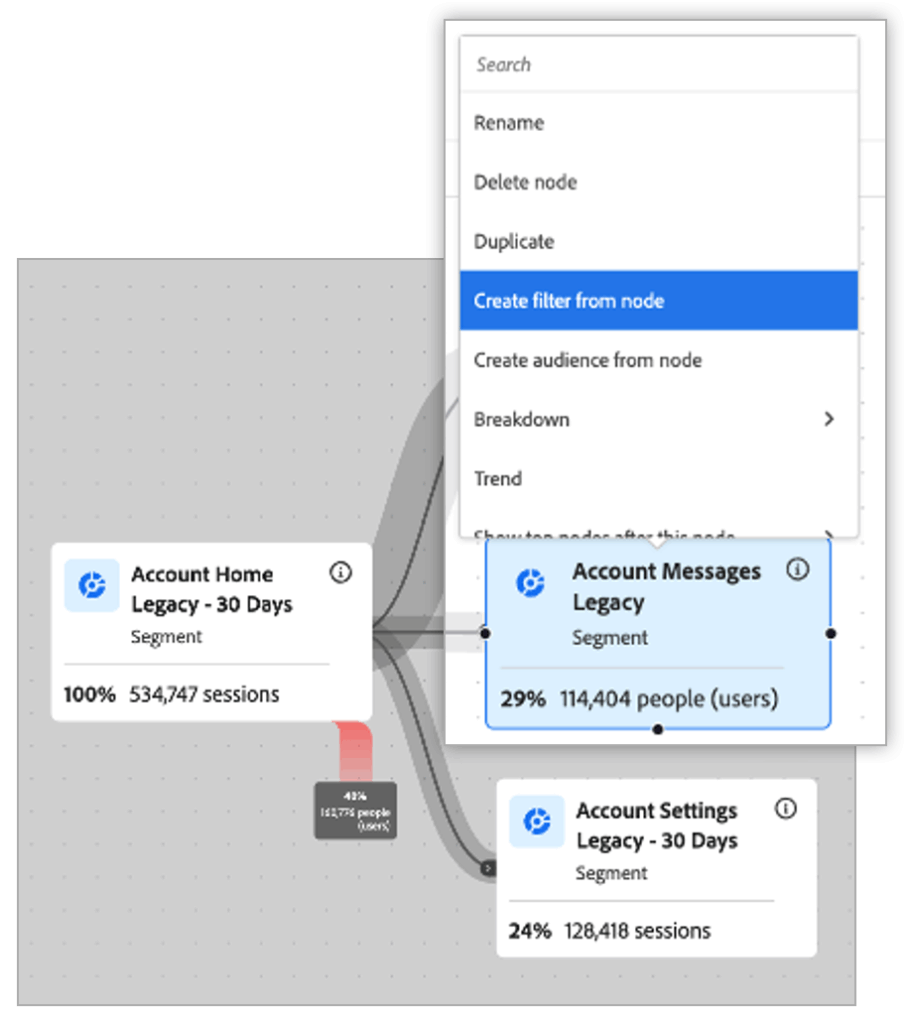
Journey Canvas provides numerous ways to do that. Right-clicking on any node reveals valuable options. One of my favorites is “Create Filter from Node,” instantly generating precise sequential segments for your chosen path. This feature dramatically reduces setup time and makes it easy to pinpoint exactly why users engage or drop off, highlighting key areas for improvement. Gone are the days of manually building complicated segments piece by piece. It’s almost magical.
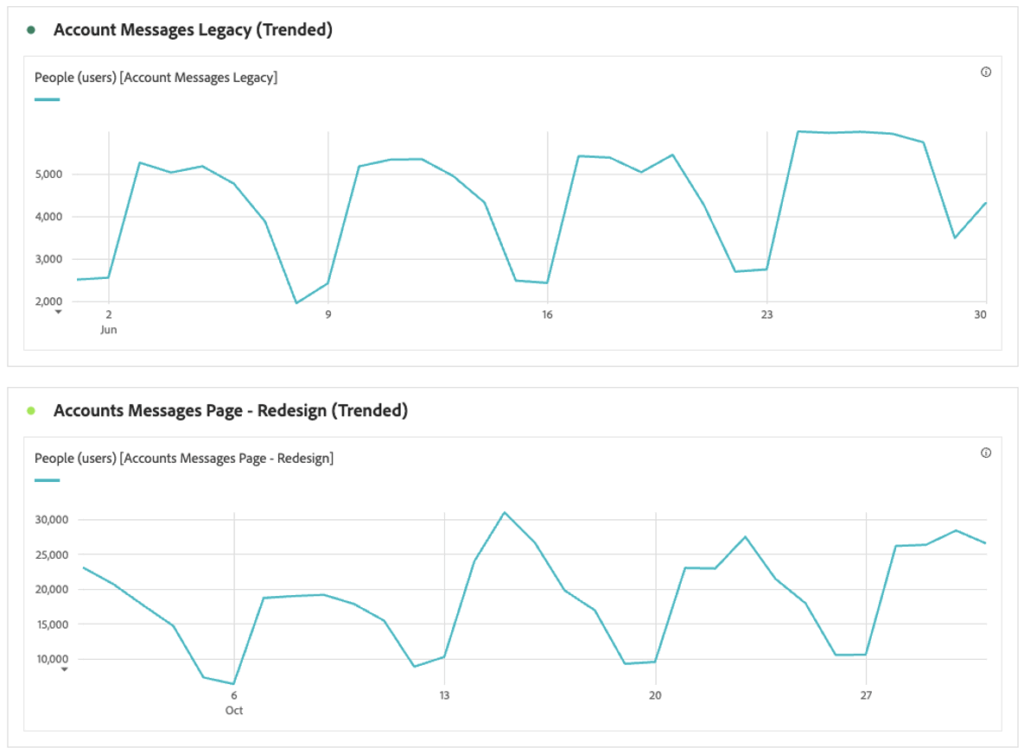
Another Journey Canvas feature that gets overlooked? The “Trend” view. This adds a time-based layer to your node performance. It lets you spot things like seasonal shifts, promo spikes, or even the fallout from a site bug that only existed for a few days. Instead of reacting late, your team can respond in near real-time—and start testing solutions sooner.
Once your segments and trends are in place, you’ve basically built yourself a flexible insight engine. At that point, it’s just a matter of digging in and surfacing the opportunities.
Impact of Journey Canvas & What Comes Next
When teams begin working with Journey Canvas in Adobe CJA, changes show up early. The data starts to take shape in ways that are easier to understand. You’re not scanning reports hoping to spot patterns. You’re watching the experience unfold in front of you, step-by-step.
Once that happens, the work speeds up. Instead of guessing where users are dropping off, you’re able to see it. You can address issues while they’re still small. The conversations shift from abstract ideas to actual user behavior. That makes collaboration smoother across product, marketing, and design.
And yes, it affects the bottom line. Better experiences tend to create better outcomes. You see it in engagement, in retention, and often in conversion rates as well.
But it’s easy to fall into the habit of chasing more data. More tracking, more dashboards, more KPIs. Without direction, all that input gets overwhelming.
That’s where Journey Canvas stands apart. It gives you a direct view into the customer experience. You can isolate trends, test assumptions, and explore flows without jumping between ten different tools. The path becomes clearer.
You’re not just watching numbers go up or down. You’re asking questions, building understanding, and putting insights into motion.
And because user expectations never stay the same for long, having the ability to adjust quickly is no longer just helpful. It’s what keeps you aligned with your customers.
Journey Canvas provides that kind of flexibility. For product, marketing, and CX teams trying to move fast without losing clarity, it has become one of the most effective tools available.
From Brackets to Better Conversions: What’s Next for Your Journey Strategy
Just like in March Madness, great outcomes aren’t about who looks best on paper—they’re about performance when it matters. The same goes for your customer experience. Journey Canvas gives you the clarity to stop guessing and start refining, so your redesigns don’t end in an early exit.
But we’re just getting warmed up.
In the next article in this Adobe CJA Tips series on Journey Canvas, I’ll walk through how Journey Canvas can help you dig deeper into channel performance—specifically how to see which sources are truly driving conversions, and where your traffic might be falling short. It’s one of the fastest ways to surface meaningful insights that often get buried in siloed reports.
Want a heads-up when it drops? Let me know here and I’ll make sure it hits your inbox first.
Need help with Journey Canvas or other parts of Adobe Customer Journey Analytics (CJA), reach out and let’s set up a time to talk.