This is the third and final article in my Adobe Customer Journey Analytics (CJA) pro tips series. In the first article, we explored how Journey Canvas supports deeper user experience analysis. The second article focused on how Journey Canvas can strengthen channel marketing strategies that drive lasting growth. Now, I’ve teamed up with BlastX Consulting colleague and Adobe expert Taylor Cruz to dive into advanced ways Journey Canvas can help you visualize customer interactions and elevate your customer experience (CX) programs. We’ll focus specifically on identifying gaps between your ideal “happy path,” the seamless journey you envision, and the actual paths available to your users.
By mapping these journeys, you’ll uncover insights into how users navigate your experiences—revealing opportunities to simplify UX and guide behaviors that support your business goals. We’ll also connect these insights to journey-level key performance indicators (KPIs) to ensure your UX optimizations drive meaningful business results.
Agile Adaptation for Smarter CX With Journey Canvas
Returning to the basketball analogy from earlier in this series, think of Journey Canvas as a coach drawing up a play. The “happy path” is your ideal scenario—a perfectly executed play that leads to points. But in reality, teams adjust, players react in the moment, and outcomes shift. The same is true in digital experiences.
Seeing the gap between strategy and real-world actions allows you to adjust in real time—improving individual touchpoints and strengthening overall CX performance.
We design paths for users, but users don’t always follow them. Journey Canvas helps you visualize both your intended play (the ideal journey) and what actually happens (real user behavior). Unlike static fallout tables, Journey Canvas captures the complexity of how users truly navigate their experiences. By defining and comparing both optimal and actual journeys, you can identify where your experience delivers and where friction emerges. Seeing the gap between strategy and real-world actions allows you to adjust in real time—improving individual touchpoints and strengthening overall customer experience (CX) performance. In the sections that follow, we’ll explore how addressing these gaps can directly improve digital experiences and deliver measurable business impact.
Bridging the Gap Between Expected and Actual Journeys
As we’ve explored in earlier articles, one of Journey Canvas’ key advantages is its flexibility. Unlike traditional pathing reports, you control how journeys are defined, mapping how users navigate complex experiences and reach conversion points. Start by outlining both the optimal path to your goal and the actual paths users take. This side-by-side view allows you to compare expectations with reality, surface areas of strength, uncover friction or systemic issues, and refine your strategy based on real user behavior.
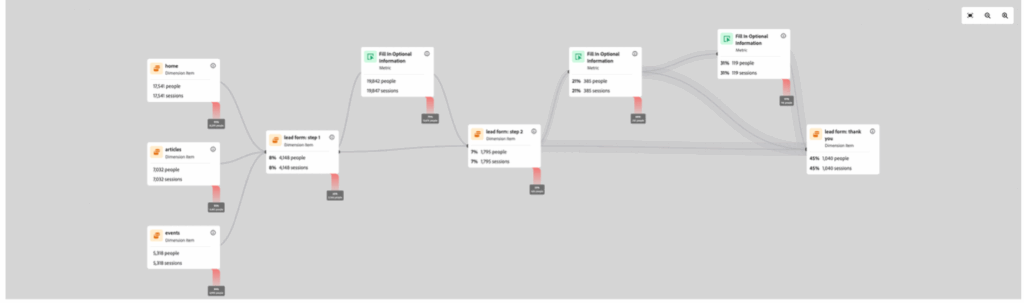
Your ideal happy path should focus on the critical steps—the most efficient sequence that allows users to complete the journey while meeting your key business objectives.
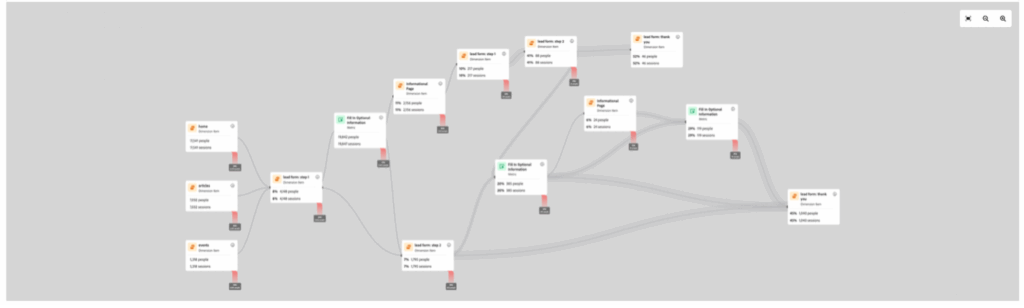
Your real paths should focus on the full range of actions users take from start to finish within the intended journey. This includes both core steps and optional interactions—like viewing related content, exploring additional pages, or taking minor detours that still align with the overall experience. The goal is to capture how users actually move through the journey, while staying focused on paths that remain relevant to your key objectives.
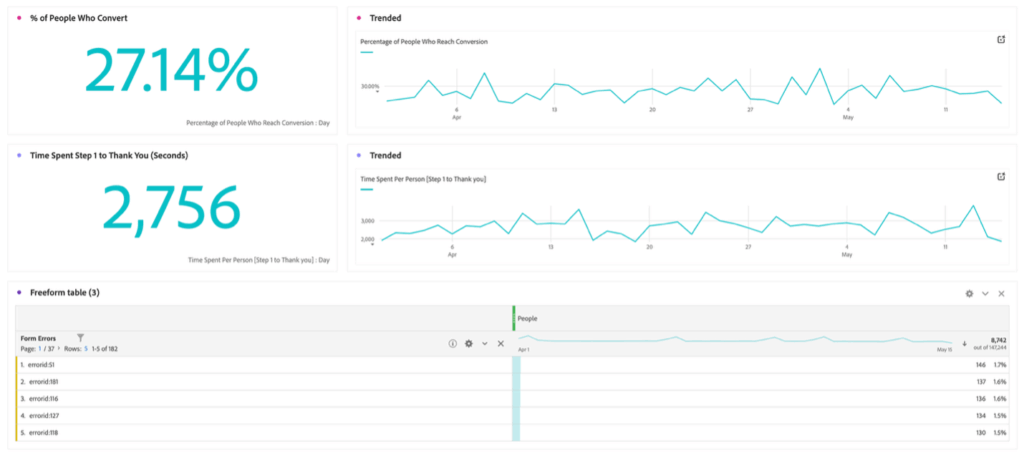
Once you’ve defined these paths, take it further by establishing key performance indicators (KPIs) and data points tied to the full customer journey. Be intentional about evaluating the entire experience—not just isolated features or individual touchpoints. Defining KPIs at the journey level allows you to track and optimize data-driven improvements over time. Examples may include:
- Percentage of users who complete the conversion
- Average time from start to completion
- Most common errors or friction points encountered
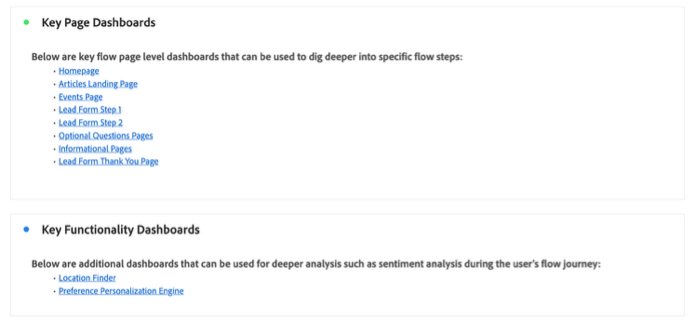
Next, use Workspace text boxes to create links to dashboards or collapsed panels that surface more detailed data within the journey. Start by building dashboards around essential pages, focusing on key actions and KPIs tied to each step in the journey. Then build additional dashboards centered on critical functionality, capturing KPIs and actions from a feature-level perspective. With these dashboards in place and strategically segmented, you can easily move between high-level insights and deeper analysis.
Adobe CJA Pro tip: Leverage Workspace’s company folders to keep dashboards organized and easily accessible, minimizing manual upkeep.
Finally, as noted in the Adobe CJA Pro Tip, you can bring everything together by right-clicking to create segments (formerly called filters) at key points in your journey. These segments allow you to analyze user behavior across the different levels of granularity you’ve built—keeping the focus on CX by anchoring your analysis to real customer behavior within the journey.
Customize Journey Canvas to Fit Your CX Needs
Adobe Journey Canvas offers flexible customization to align visualizations with your specific CX goals. In addition to the options covered in Adobe CJA Pro Tip #2, explore these features:
- Toggle fallout visibility to focus on segments such as fall-through and fall-out.
- Set primary and secondary metrics at each step for deeper performance insights.
- Switch container types (person vs. session) to view journeys from different CX perspectives.
- Add flow line labels to provide context for each journey path.
- Rename journey steps to tailor views for different audiences, from analysts to executives.
Correctly Optimizing Journey Canvas Drives Better Performance
Adobe CJA Journey Canvas serves as a central hub, enabling teams to align around a shared visualization and data set for customer journeys. Unlike traditional flow or fallout reports, Journey Canvas remains consistent across timeframes—only the underlying data shifts based on your selected date ranges. This consistency allows everyone, from analysts to executives, to work from unified KPIs and CX dashboards, while still having the flexibility to drill into detailed reports as needed.
This approach helps keep customer experience front and center, ensuring teams stay focused on optimizing journeys rather than getting lost in fragmented data. By clearly separating your designed happy paths from the real paths users take, you gain critical insights into friction points, bottlenecks, and areas of user frustration. For example, you may expect users to move from a product listing page (PLP) to a product detail page (PDP) before completing checkout. But actual behavior may show users skipping the PLP entirely, using site search to go straight to the PDP. In that scenario, continued PLP optimizations won’t address the real issue—potential gaps in search experience or missed opportunities to guide users back into PLPs effectively.
By identifying and optimizing these areas, you increase user satisfaction and boost the number of users following the happy path—which often drives higher conversion rates and directly impacts business performance. Evaluating actual user paths allows you to prioritize where optimizations are most needed, whether that means improving existing behaviors or guiding users more effectively toward your ideal journey. Journey Canvas helps your team stay grounded in real user behavior, accelerate issue identification, and optimize not just isolated touchpoints, but the full customer experience.
Your Best Path Forward with Adobe CJA and Journey Canvas
To summarize, Adobe CJA Journey Canvas allows you to map key user journeys and visualize both ideal and actual paths—much like a coach drawing up plays, then analyzing how the game truly unfolds. Set clear objectives aligned to business outcomes, define performance metrics such as conversion rates, completion time, and user errors, and connect each journey step to relevant dashboards for deeper, ongoing analysis.
By taking these steps, your team can adapt in real time, responding to evolving user behavior and optimizing digital experiences as conditions evolve. With this approach, you’re positioned to turn insights into action—improving every touchpoint across the customer journey and driving measurable CX improvements.
If you’re looking to get even more from Adobe CJA Journey Canvas or need help applying these strategies inside your organization, we’re here to help. Just reach out.