

Behavioral data shows where a customer journey works, where it breaks, and where we make customers work harder than they should. The value isn’t in collecting more activity. It’s in understanding what that activity means.
Most broken digital experiences don’t look broken in a dashboard.
A customer may still complete the form. A shopper may still check out. A visitor may still spend several minutes on a page. From a distance, those outcomes can look healthy. But behind the conversion may be repeated searches, form errors, backtracking, slow responses, confusing content, or a workaround the customer had to invent to finish the task.
That distinction matters because poor experiences have real economic consequences. Qualtrics XM Institute’s global consumer research found that 11 percent of experiences were rated as bad and 47 percent of those bad experiences led customers to reduce or stop spending. Its 2026 analysis estimates nearly $2.94 trillion in global sales is at risk from poor customer experiences.
The hard part isn’t proving that bad experiences are expensive. The hard part is catching friction early enough to act. A broken experience rarely begins with one dramatic failure. It begins with small signals that teams either detect or miss.

What Behavioral Data Is Telling Us
Behavioral data is the evidence created by what people do as they interact with a website, app, product, or connected journey: navigation, searches, form interactions, errors, feature usage, completion, abandonment, and return behavior.
That makes it useful for seeing the gap between the experience we intended to create and the one customers actually have.
But collecting more events doesn’t automatically create more understanding. As noted in another recent Insight, sound behavioral data collection starts with business objectives, journey requirements, and the decisions the data needs to support. Measurement should capture meaningful progress, not simply every available click.
That’s a principle I come back to in analytics engineering. A button-clicked event may show intent, but not success. If a customer clicks Submit and receives a validation error, the click happened; the journey didn’t progress.
Good behavioral data should help us distinguish among:
- Intent: What was the customer trying to do?
- Progress: Did the journey move forward?
- Friction: What interrupted it?
- Completion: Did the task actually succeed?
- Return behavior: Did the experience give the customer a reason to come back?
Designed around those questions, behavioral data becomes evidence of the customer experience rather than clickstream history.
How Behavioral Analytics Reveals Broken Digital Experiences
Conversion rate is useful. It’s also a lagging outcome.
Digital experience metrics matter more than conversion data because conversion only confirms an outcome happened. It doesn’t show how much hesitation, effort, confusion, or frustration occurred along the way.
Behavioral analytics fills in that missing part of the story.
A 2025 report from Contentsquare revealed that almost half of online visits encountered preventable friction. The organizations in its benchmark that actively monitored and managed digital experience performance reduced friction 4.5 times more effectively than their peers.
The point isn’t that every rage click or abandoned step represents a crisis. The point is that these behaviors give teams somewhere useful to investigate.
Common signals include:
- Repeated searches or refinements
- Form errors and retries
- Backtracking or quick returns to a previous page
- Dead clicks or rage clicks
- Unexpectedly long task completion
- Repeated interaction with the same control
- Excessive scrolling without progression
- Performance delays or failed requests
- Abandonment at a specific point in the journey
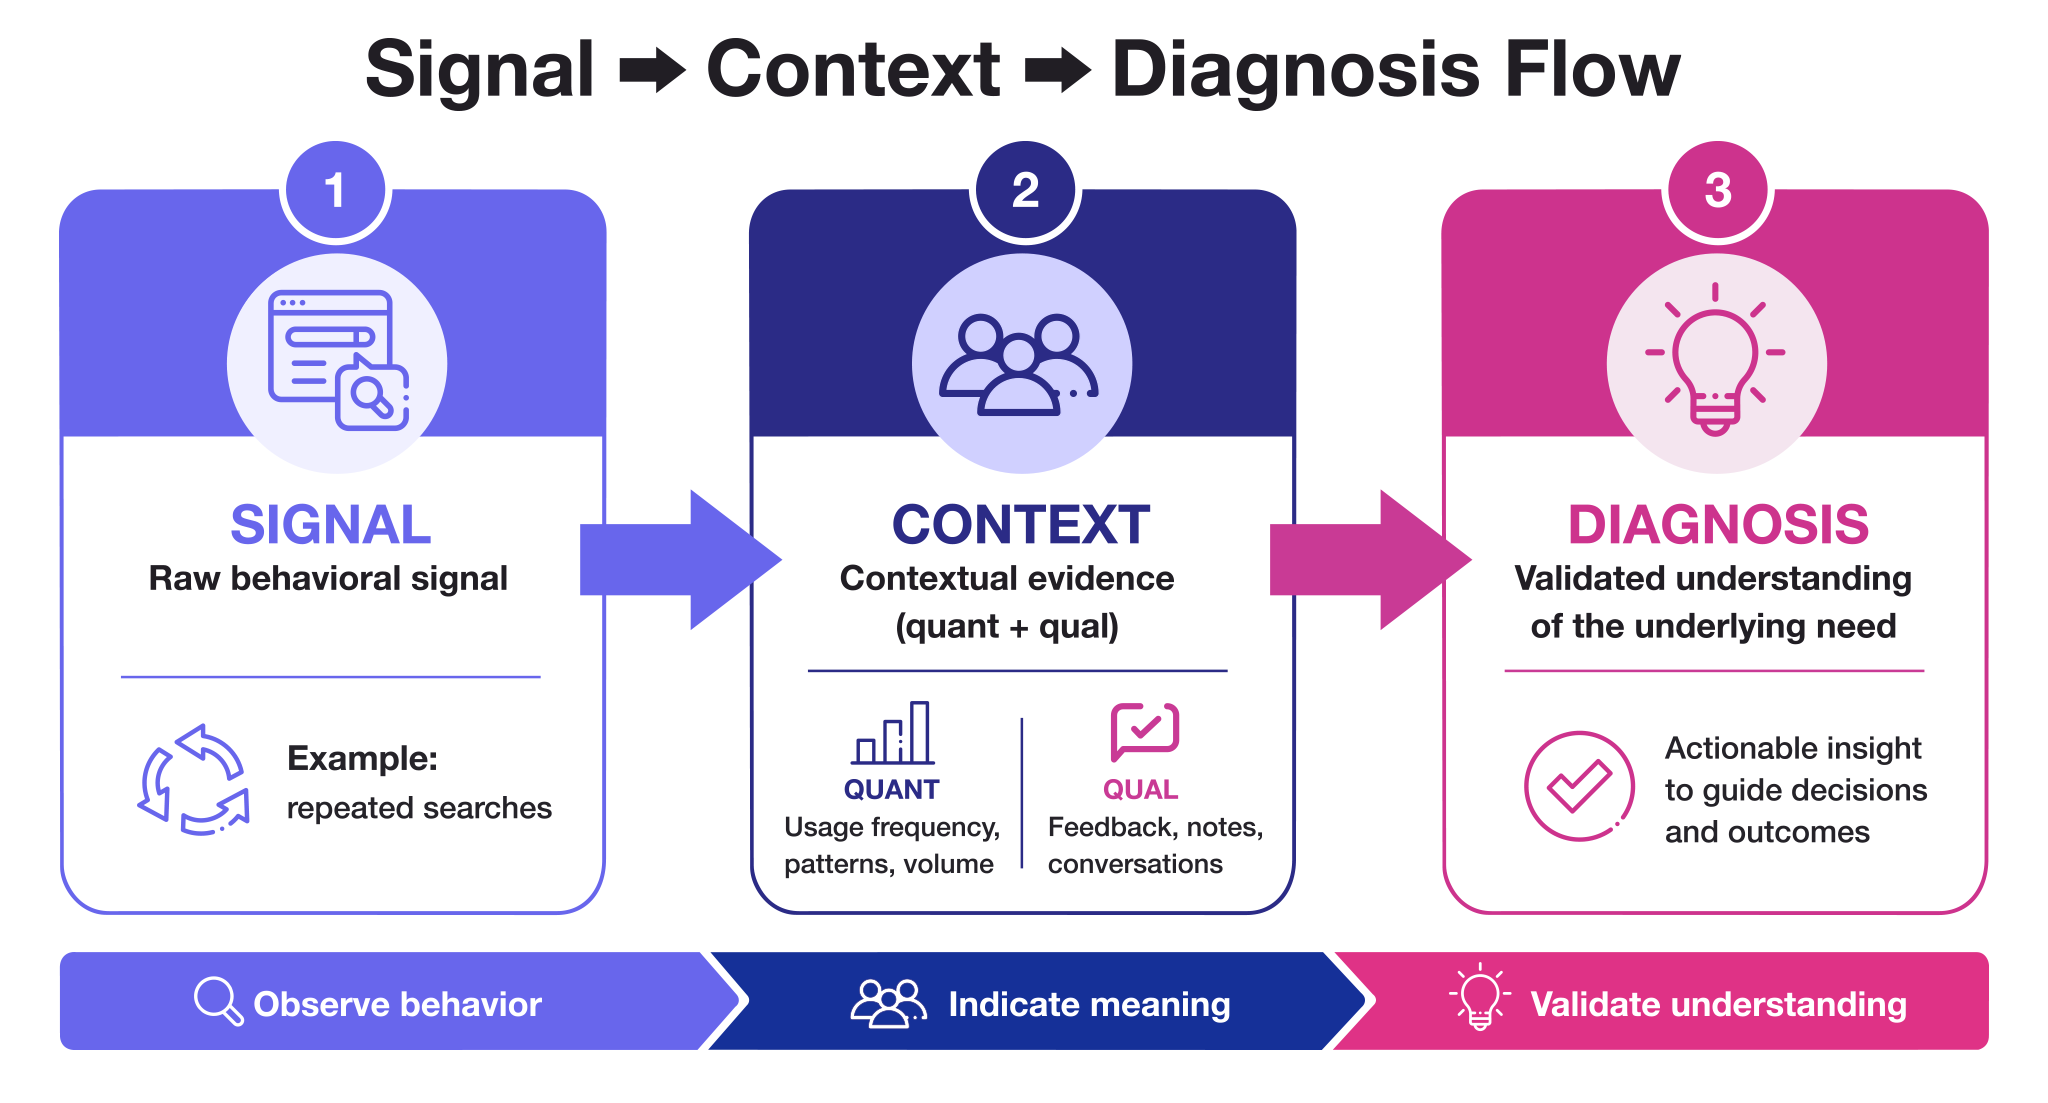
None of those signals is a diagnosis on its own. A long visit can mean strong interest or deep confusion. A quick exit can mean dissatisfaction or that the customer found the answer immediately. Context determines meaning. Behavioral signals tell us where to investigate. It doesn’t automatically tell us what to fix.
That’s where experienced analysis matters. We look for patterns, compare segments, check technical conditions, and test whether several pieces of evidence point to the same problem.

Good UX Signals Progress, Not Friction
A good user experience isn’t simply a polished interface. It’s an experience that helps people accomplish what they came to do with clarity, confidence, and reasonable effort.
In behavioral data, that often looks like progress, not activity.
A customer who finds the right information in two steps may generate fewer pageviews than someone who wanders through six pages. That doesn’t make the second customer more engaged. It may mean the first experience was better designed.
This is why I’m cautious with isolated engagement metrics. Time on page, pages per session, scroll depth, or feature interactions can all be useful, but only when you interpret them against the customer’s goal.
A strong experience should generally make it easier for customers to:
- Find what they need
- Understand what happens next
- Complete a task without unnecessary repetition
- Recover from an error
- Move between related touchpoints without losing context
- Trust that the system responded as expected
If high engagement is accompanied by repeated searches, backtracking, errors, and low completion, we shouldn’t celebrate the engagement. We should ask what made the customer work so hard.
Activity isn’t the same as progress.
That’s one reason I recommend looking beyond conversion and using a broader set of digital experience metrics to understand how the journey actually performs.

Why Teams Stop Trusting Customer Behavior Data
We also need to consider another type of experience: how our own teams use the data.
Can analysts trust the events? Do product, marketing, engineering, and CX teams agree on what the metrics mean? Are important actions missing? Are events duplicated? Does a conversion represent a completed business outcome or merely a button click?
These questions aren’t technical housekeeping. They determine whether the organization can act with confidence.
Gartner notes that poor data quality costs organizations at least $12.9 million per year on average, based on its research, and reports that 59 percent of organizations don’t measure data quality. Those numbers are enterprise-wide, but the underlying lesson applies directly to digital analytics: bad data creates cost long before anyone labels it a data-quality problem.
A broken analytics implementation can produce a beautifully formatted dashboard. That’s what makes it dangerous.
A form-start event that fires on page load can inflate apparent engagement. A conversion event that fires twice can overstate success. Missing tracking inside a single-page application can make an entire content journey look quieter than it really is. None of those problems announces itself with a red warning banner. Teams may make decisions based on the wrong picture.
A recent Insight on data distrust and analytics investment addresses the organizational consequence of poor quality: when people stop trusting the numbers, decisions slow down, verification loops grow, and analytics becomes something teams debate rather than use. You can’t confidently improve an experience with behavioral data your organization doesn’t trust. The remedy isn’t perfect data everywhere. It’s dependable data for the decisions that matter, which includes clear definitions, durable event design, ownership, quality monitoring, consent-aware collection, and QA that validates the customer journey, not just tag firing.
You can’t confidently improve an experience with behavioral data your organization doesn’t trust.
A Systems View: What Behavioral Data Doesn’t Show You
I happen to have a background in architecture. That background shapes how I think about digital analytics.
A building is experienced as one place, even though structure, circulation, electrical, mechanical, communications, accessibility, and safety systems must work together behind the walls. A failure in one hidden system can affect the whole experience.
Digital journeys are similar. The customer sees one experience. Behind it may be a content platform, identity service, tag manager, consent platform, CRM, APIs, experimentation tools, and several teams with different owners and priorities.
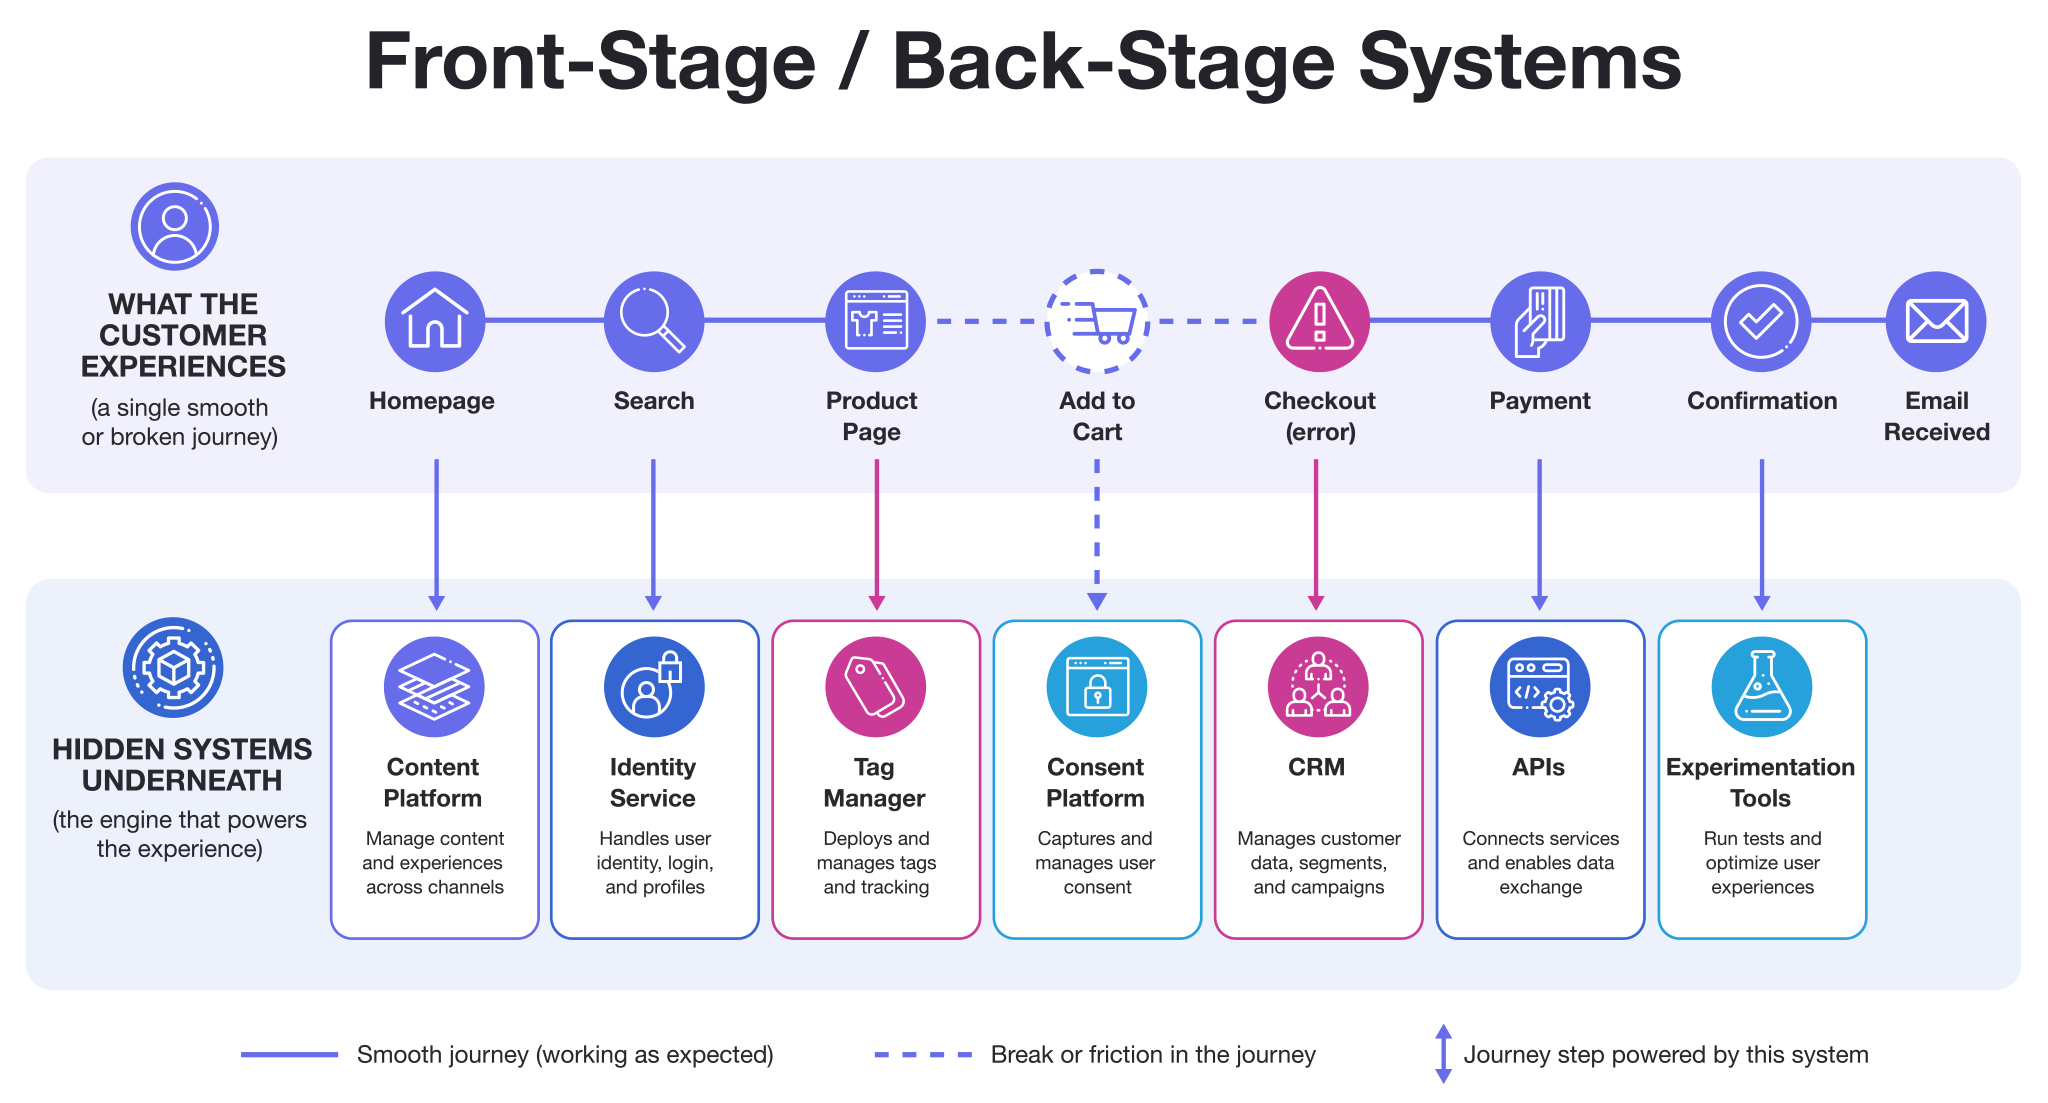
Customers don’t care which system owns the problem. They feel the delay, the inconsistent message, the lost form state, or the handoff that makes them start over.
That changes the diagnostic question from “Which page is underperforming?” to “What part of the system made this customer behavior necessary?”
A customer journey map used as a living decision tool helps put those signals in context by connecting the customer’s goal to the front-stage experience and the backstage systems and ownership shaping it.
That’s where analytics starts to become part of experience design, not just reporting.
What Behavioral Data Won’t Tell You
Even strong behavioral data has boundaries. Analytics may show repeated searches after customers land on a product page, but not whether the terminology is unfamiliar, the content is incomplete, or the navigation sets the wrong expectation.
A better approach combines quantitative and qualitative data. Quantitative evidence shows patterns at scale. Qualitative evidence adds motivations, expectations, and context.
| What we observe | What it may indicate | What helps validate it |
|---|---|---|
| Repeated searches | Poor findability or unclear terminology | Search terms, replay, interviews |
| Form retries | Confusing requirements or validation | Error detail, replay, support themes |
| Quick backs | Expectation mismatch | Entry source, content, feedback |
| Repeated failed actions | Broken functionality or latency | Technical logs, replay, QA |
Connecting Customer Journey Analytics and Voice of Customer data is one way to make that combination concrete. When analysts and users evaluate behavioral data alongside survey feedback, a poor experience rating becomes more actionable because they can investigate the journeys and errors behind that feedback.
Behavioral data finds the pattern. Qualitative evidence helps explain it. Together, they give us a much stronger hypothesis about what needs to change.
Finding Behavioral Friction Is Only the Beginning
Behavioral data gives teams something every CX program needs: evidence of where the intended journey and the actual journey are drifting apart. But identifying friction isn’t the finish line.
Once we know where customers are struggling, a harder set of questions follows. Which problems deserve investment first? Which changes will improve engagement, retention, or conversion? How do we know the intervention worked? And how do we keep a successful improvement from becoming another one-time project? That’s where behavioral insights need to move from diagnosis to action.
In Part Two of this series, we’ll look at how to connect customer behavior to business outcomes, validate improvements through experimentation, and turn better experiences into returns you can measure, repeat, and compound.
Finding friction tells you where your customers’ experiences need attention. What you do with that evidence determines whether anything actually improves.
Finding the friction is only half the job. Turning what you learn into real, repeatable improvement is where we pick up in Part 2. Stay tuned for that soon.
In the meantime, do you want to know if there’s friction you can’t see? Consider a CX ROI Diagnostic to see where behavioral data shows your customer journey is breaking. There’s no commitment required. You’ll get clarity through a prioritized list and expert guidance on where to direct your customer experience efforts and investments.